All published articles of this journal are available on ScienceDirect.

Greenhouse Gas Emission, Rainfall and Crop Production Over North-Western India
Authors Info & Affiliations
Abstract
Background:
This study is based on datasets acquired from multi sources e.g. rain-gauges, satellite, reanalysis and coupled model for the region of Northwestern India. The influence of rainfall on crop production is obvious and direct. With the climate change and global warming, greenhouse gases are also showing an adverse impact on crop production. Greenhouse gases (e.g. CO2, NO2 and CH4) have shown an increasing trend over Northwestern Indian region. In recent years, rainfall has also shown an increasing trend over Northwestern India, while the production of rice and maize are reducing over the region. From eight selected sites, over Northwestern India, where rice and maize productions have reduced by 40%, with an increase in CO2, NO2 and CH4 gas emission by 5% from 1998 to 2011.
Results:
The correlation from one year to another between rainfall, gas emission and crop production was not very robust throughout the study period, but seemed to be stronger for some years than others.
Conclusion:
Such trends and crop yield are attributed to rainfall, greenhouse gas emissions and to the climate variability.
1. INTRODUCTION
In South Asian countries, India has a big contribution with agricultural grain and food productions especially rice import (Gaiha and Kulkarni, 2007) followed by other Asian countries. A good portion of the Indian landmass is surrounded by oceans, one of the main sources of CO2 and moisture during summer monsoon (Gurber et al. 2009). From the time of industrial revolution, the concentration of the tropospheric CO2 rose from 290 to 403.64 ppm, NO2 rose from 270 to 326 and CH4 rose from 722 to 1893 ppm (CDIAC 2015). Water vapor, CO2 and CH4 are the three top most greenhouse gases for global warming potential (Daniel 1999). These greenhouse gases keep on increasing in the atmosphere and have an adverse impact on human health and grain production (Horowitz 2006; Avnery et al. 2011). The sources of these greenhouse gases (e.g. CO2, NO2, CH4) are transportation, combustion, fossil-fuel burning, ocean and wetlands. In India, during monsoon season, the possibilities of the production of the greenhouse gases increase, because of the monsoonal winds passing over the ocean surface, and the land becomes wet and soggy and live stocks also get wet. NOx gases emit due to fertilization scattering in farm lands, wetland and the augmentation of the first rainfall over dry land (Mosier et al. 2003). India is one of the countries known for agriculture and farming tied with monsoonal rainfall (Gadgil and Gadgil 2006). Methane is formed due to microscopic organisms living in falling leaves from the tree and in rice plant’s roots (Groenigen et al. 2011). Ocean stores CO2 in the form of HCO3- (carbonate ion) in the mixed layer and deep water which comes upward on the surface from equatorial and subtropical ocean upwelling where temperature is around 29oC (Somero et al. 2016).
During summer, farming in India depends on the monsoonal rainfall (Krishna Kumar et al. 2004). Natural rivers, canals, lakes and ponds are not sufficient to fulfill the need of water for farming and bio diversity. Every year, Indian summer monsoon pours copious rainfall over Indian landmass from June to September (Parthasarathy and Mooley 1978). India has 70% (86cm) of its annual rainfall within 4 months of summer. Indian summer monsoon rainfall initiates around June 1, over the coast of Kerala state (Fig. 1) and gradually progresses northward, finally covering all Indian landmass by July 15. In Fig. (1), smooth and curved lines of blue-red are oriented from west to North-East and North, demonstrating five days’ northern limit of accumulated rainfall. These are the climatological dates of the very first summer rainfall across every state over the Indian subcontinent.
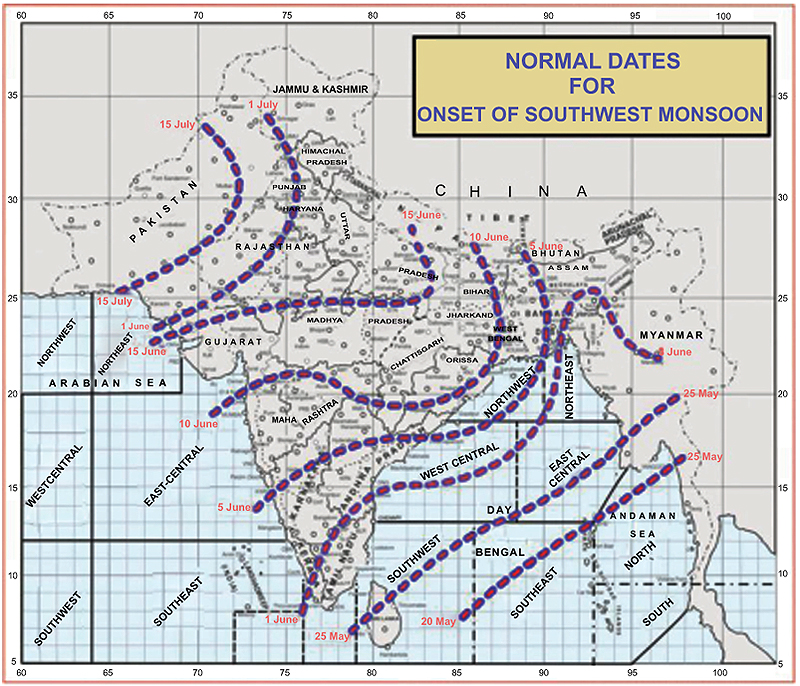
The isochrones of the onset of monsoon and northern limit of monsoon keep on varying each year (Kumar and Krishnamurti 2013). At the first arrival of monsoonal rain over a region, farmers of that region start to germinate the seeds for the new crop of rice. India is the second leading country after China, which produces the maximum load of rice annually. From south to north, Indian farmers are actively engaged in sowing rice, coffee, tea, rubber, maize, various kind of millets and cotton crops (Prasanna 2014). He further added if the monsoon rainfall is delayed, the growth of the crop cultivation is also halted and affects the production of those crops for the year. It was experienced that the production of crop declined during recent major drought years like 2002, 2004, 2009 and 2014. Next, South Asian countries are known for the polluted air due to aerosol, burning of the crops and dust (Ramanathan et al. 2005). Polluted environment, due to greenhouse gas emission, droughts, food production and societal degradation, directly influences the Gross Domestic Product (GDP) and Food Grain Production (FGP) of India (Kumar et al. 2013). Obviously, FGP shows a decreased trend during drought years (Gadgil and Gadgil 2006; Sinha 2009).
Many studies revealed that extreme rainfall events are increasing over Indian region (Goswami et al. 2005; Rajeevan et al. 2008). During 1980-1990, the monsoonal rainfall used to be very continuous, light to moderate for 3-4 days. Such kind of rainfall can be compared with the drip irrigation for agricultural crops. Nowadays, monsoonal rainfall is very heavy or very light and lasts for a smaller duration and quickly, water makes the way into rivers and ponds. Porous of the soil get clogged due to the bombardment of heavy rainfall thus soil could not absorb water to the deeper layer. There is a mix response from many recent studies on both the increasing and decreasing trends of Indian summer monsoonal rainfall (Goswami et al. 2006; Bollasina et al. 2011).
The production of rice and maize is being affected by climate variability (Ray et al. 2015). Rice produces a significant amount of methane due to stagnant water and rotten substances in the paddy field. Basically, these are microscopic organisms that respire CO2 and produce methane (CH4). No doubt, the emission of methane will become all most double fold for per kg of rice production against the projected estimates of CO2 and atmospheric temperature by the end of this century (Groenigen et al. 2012; Lobell et al. 2013). The model projections seem lower than that expected in the higher CO2 environment (Long et al. 2006). The land of the northern India is generally very dry before the arrival of monsoon. Jaegle et al. (2004) found the emission of NOx from dry soil, when it gets wet for the first time. Other sources of the NOx are nitrogen laced fertilizer for soil, dry forest and grassland-savannas (Ghude et al. 2014). Other main sources of gas emissions (CH4 and NOx) are the industrial developments for the economic growth of a country. All around the metro cities, a lot of industrial development has been made for the convenience of transport and utilities, contribute to greenhouse gases (Sahu et al. 2014). Obviously the sink and sources of these gases are located over ocean and land, both (Watson et al. 1992).
Individually, there are plenty of research works explaining the role of various greenhouse gases and their influence on crop production and the impact of rainfall on food production. However, there are not much progress on the research which explains the role of greenhouses gases and summer rainfall on crops production. Understanding the role of greenhouse gases and rainfall on grain production over the northern region is the main objective of this research work. Here, we tried to relate rainfall and greenhouse gases variability against the production of grains over northern Indian region. Average summer rainfall does not seem to show any trend over India but showing an increasing trend over few pockets/cities. From the literature survey, we realized that greenhouse gases have great bearings on the crop yields, like rice and maize. Due to such intriguing facts for rainfall, greenhouse gases and grain production drew our attention for investigation. Are rainfall and greenhouse gases considered the main reasons behind the reduction of rice production? The present manuscript is dealing with the main sources and potential impact of three greenhouse gases (CO2, CH4 and NOx) on the crops of rice and maize over north India. Based on the literature survey and objective of this research work, we do hypothesize that increasing the greenhouse has a more impact on the crop’s production despite increasing trend of rainfall.
2. METHODS
We used the trend analysis on rainfall, crop production and greenhouse gases, which facilitates about their increasing and decreasing tendency with time. Another skill matrix was used in this study known as the Pearson correlation among rainfall, crop production and greenhouse gases.
2.1. Datasets Used
The data used in this study were obtained from various sources for the duration of northern summer. CO2 datasets (mole/m2/sec) were acquired from APDRC; those were model generated (Takahasi et al. 2007). The resolution of datasets is 1x1 deg lonlat and the datasets were generated using offline transport model at National Institute for Environmental Studies (NIES), Japan. The assimilated CO2 flux showed a good correlation on interannual scale with the CO2 flux obtained from atmospheric inversion (Valsala and Maksyutov 2010). As a limitation, CO2 data was available up to 2009 only. Rainfall data were taken from TRMM 3B42 monthly data for the period of 1998-2014 (Huffman et al. 2007). TRMM datasets were comparable against any contemporary datasets over Indian region with good quality check, resolution and coverage. Furthermore, rainfall data were also obtained from coupled model HadGEM2-ES for 1998-2012, which is better known for historical experiment datasets from CMIP5 (Taylor et al. 2012). HadGEM2-ES is an earth system model with a resolution of 1.875x1.25 deg lon-lat, 40 vertical levels, taken from Hadley center UK (Collins et al. 2008). Martin et al. (2011) found comparable climate variability in the simulations of HadGEM2-ES against observations and other models. All other datasets of gas emission (NO2 and CH4) were acquired from TEMIS (Boresama et al. 2004). Optimum Interpolated SST was obtained from NOAA/NCEP (Reynolds et al. 2002).
3. RESULTS
3.1. Variability and Sources of CO2 in Indian Subcontinent
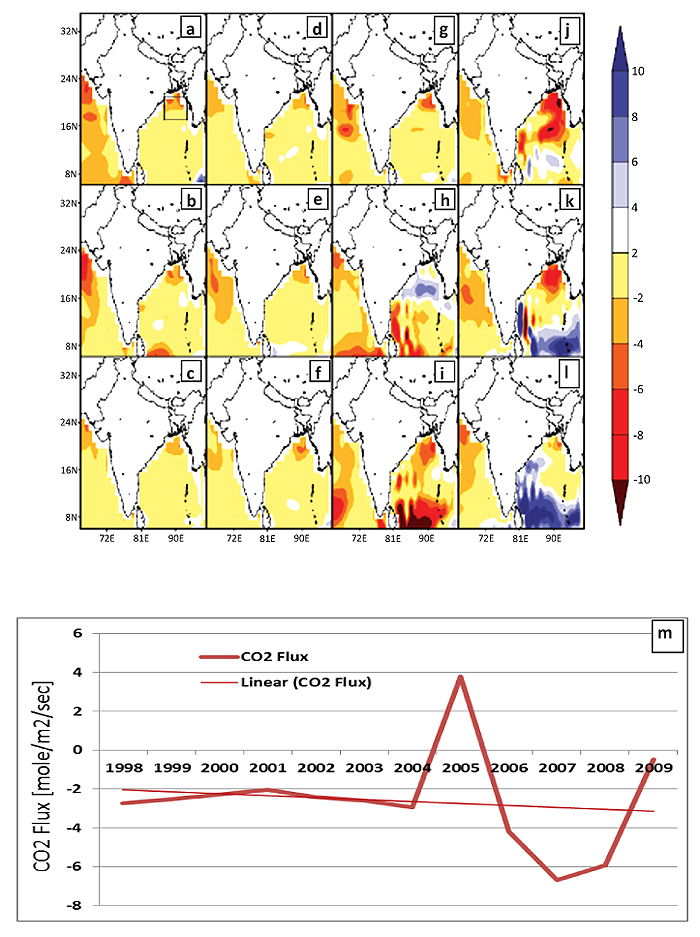
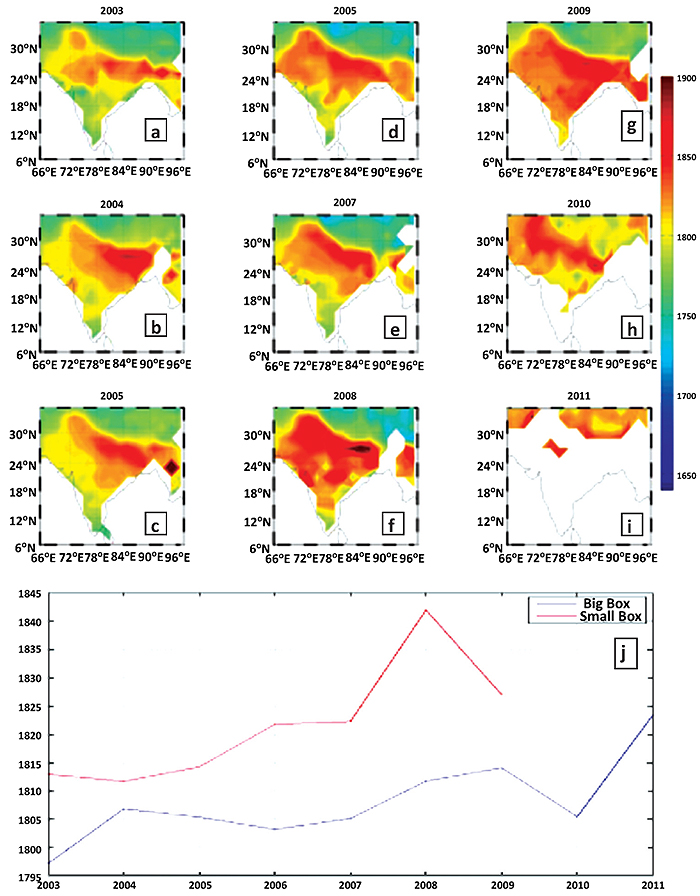
Oceans are considered one of the main sources and sinks of the greenhouse like water vapor and CO2. At polar regions (colder region), CO2 is sub-ducted, and over the equatorial region, (warmer regions ≥ 29oC) it is exposed to atmosphere (Matthews 1999). Fig. (2) shows spatial pattern of CO2 flux anomalies from 1998 to 2009 for summer (June to September) over the ocean. The figure shows that CO2 flux enhanced continuously from 1998 to 2009 over Bay of Bengal (Figs. 2a to 1). Positive values of CO2 signify downward flux while negative values signify upwards flux. Over the Bay of Bengal, optimized air-sea CO2 flux (mole/m2/sec) showed an increasing trend of outgoing CO2 (Fig. 2m), averaged over a box (18-23oN, 88-92oE; see in Fig. (2a)). Increased CO2 is considered for a better growth of plants and yield of rice crop (Groenigen et al. 2013). In general, the region of Bay of Bengal is very active during Indian summer monsoon. The wind speed over most of the Indian subcontinent has the order of 10-12 m/sec. Such intense winds can carry moisture and CO2 from ocean to the northern landmass of India. From AIRS satellite datasets, it was found that the CO2 was not mixed well over Indian landmass and over the surrounding oceans (Bay of Bengal, Arabian Sea and Indian Ocean). This research work does not ignore the fact of CO2 emissions from Indian landmass by industrial developments/manufactures, population and from other sources.
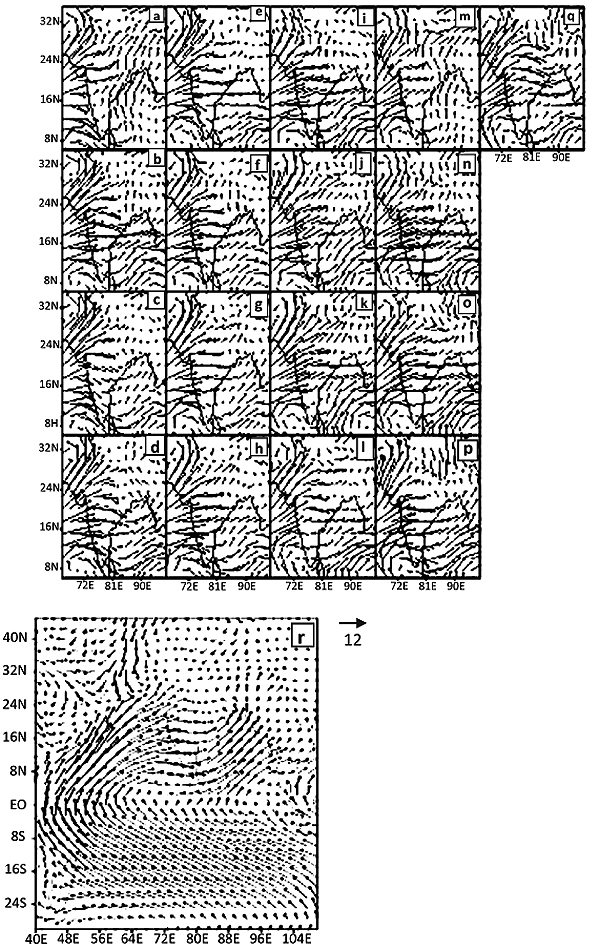
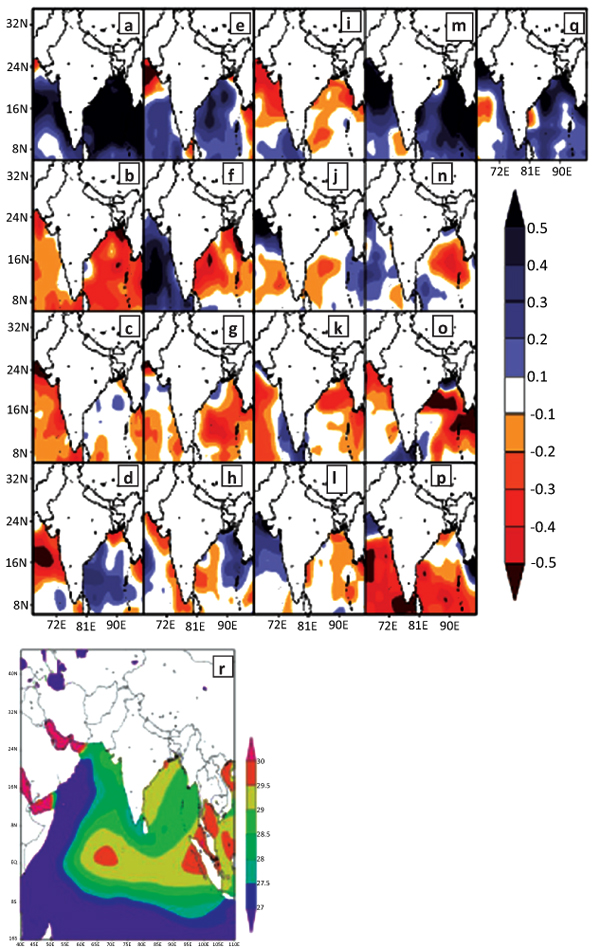
The wind anomalies from 1998 to 2014 are shown in Fig. (3a to q, r) shows climatologically wind pattern across Indian sub-continent, which appears to be turning to Indian region from the Bay of Bengal. These panels of wind anomalies demonstrate how every year wind carries a substantial greenhouse gas emitted from the ocean. To further demonstrate the importance of warmer sea surface temperature in relation with CO2, Figs. (4a to q) displays the NOAA OISST anomalies from 1998 to 2014. Fig. (4r) illustrates the climatological Sea Surface Temperature (SST) for summer monsoon around Indian region. Most of the time, SST over the Bay of Bengal remains quite high. The factors of intense wind and warm SST help to enhance the upward CO2 flux over the Bay of Bengal region. CO2-laced monsoonal winds enter Indian region during the summer, a season when Indian farmers start to sow the crops of rice and maize. Elevated CO2 and global warming may affect the yield of rice production.
3.2. Variability of NO2 and CH4 over Indian Region
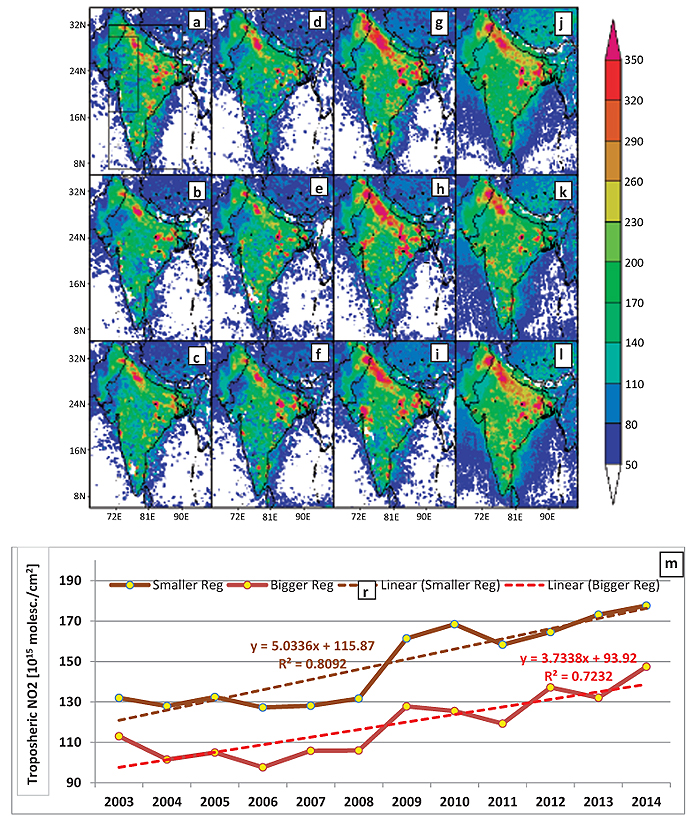
The Punjab state is best known for “Grain Bowl” of India, which is very well irrigated by monsoonal rain, natural rivers and canals. To increase the production of crops, farmers utilize urea and nitrogen-allied fertilizer, which is one of the most common reasons of NO2 emission from farming. Tropospheric NO2 was from 2003 to 2014 for summer (Figs. 5a to 1). At first glance, one can easily come out with a point that from Punjab to West Bengal, NO2 was monotonically increasing. Two rectangular boxes were considered to investigate the gas emissions and their association with crop yields. Fig. (5m) shows an increasing trend of the tropospheric NO2. The value of the coefficient of determination (R2) was observed to be quite high for both the line graphs. Emission of NO2 from other sources like industrial development and crowded traffic are very well known on Gangetic plains of India (Figs. 5a to 1). Other noticeable areas where NO2 was found to increase were Arabian Sea and Bay of Bengal. Sheel et al. (2010) and Ghude et al. (2014) showed an increasing trend of NO2 for the Indian mega cities due to industrial development and traffic growth. NO2 is contributed by not only transportation, road vehicles, soil, fodders, but a good portion of it is provided from the ocean as well.
Methane is the very next greenhouse gas which is produced anthropogenically as a product from rice crops (Groenigen et al. 2011, 2013). As compared to CO2, the quantity of CH4 is very less in the atmosphere but the contribution for global warming is many folds than CO2. CH4 dataset was available only for 9 years from 2003 to 2011. Retrieved CH4 enhanced a large part of India except Southern India. There was an enhancement of CH4 over Indo-Gangetic plains, a region of rice crop production and irrigated by monsoonal rain. Figs. (6i to j) shows the increasing trend over bigger and smaller rectangular boxes from Indian landmass region. This greenhouse gas is mainly produced from rice crops due to micro-organism at their roots in water loaded fields.
3.3. Association between Rainfall Variability and the Emission of Gases over Indian Region
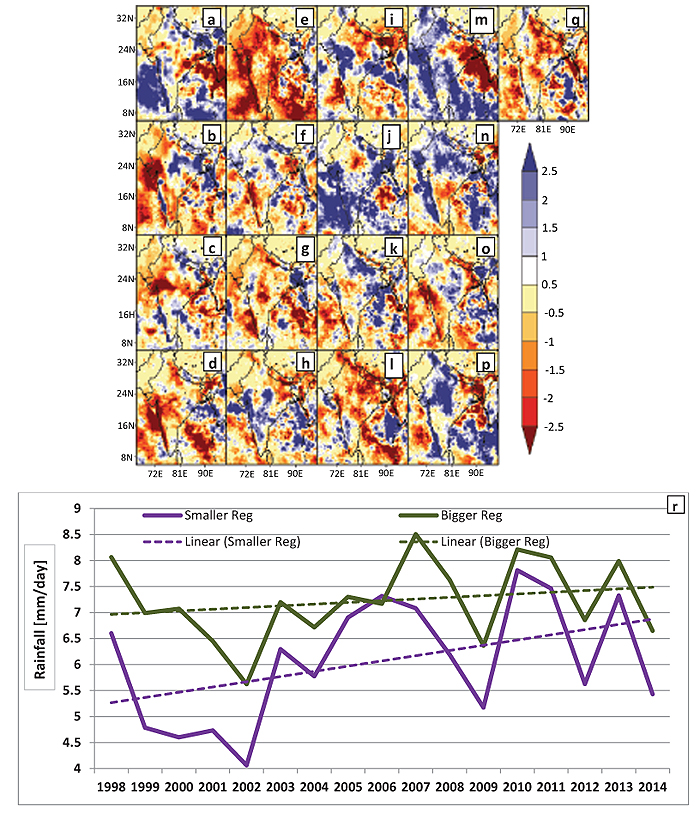
In the summer and rainy season over Indian region, NO2 emits to the atmosphere from dry soil (when it gets first time wet), wetland, live-stocks and commonly used urea fertilizer used for farming (Jaegle et al. 2014). The paddy fields are stranded with water in summer monsoon season. The roots of paddies are the main sources of CH4 production. Here, it will be interesting to analyze the variability in rainfall in connection with gas emissions and crop yields. Indian summer monsoon rainfall has a great temporal and spatial variability. This research work analyzed 17 years of monthly rainfall data from TRMM. Fig. (7a to q) shows the rainfall anomaly for each year averaged for summer (June to September). Indian landmass is witnessed with the series of drought and flood years on annual scales. For years 2006, 2007 and 2010-2013, Western India witnessed an increasing trend of widespread rainfall during a summer season. Rainfall averaged over a bigger region (70-900E; 7-320N) and smaller region (70-780E; 17-300N) shows an increasing trend (Fig. 7r). These two curves almost follow the same variation of ups and down representing the same variability of rainfall over small and bigger region. To note, Western Indian region is an almost arid region as compared to the rest of India.
3.4. Rainfall, Greenhouse Gas Emissions and Crop Yield
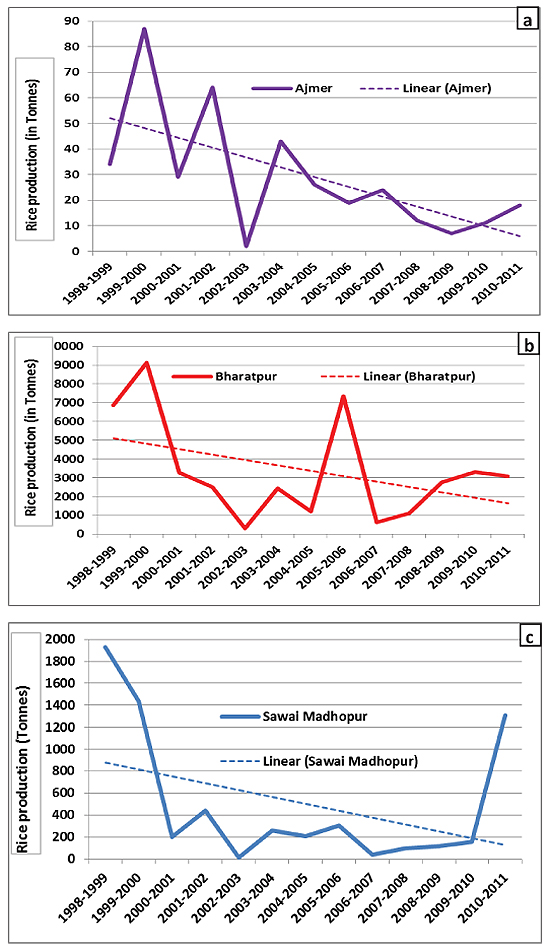
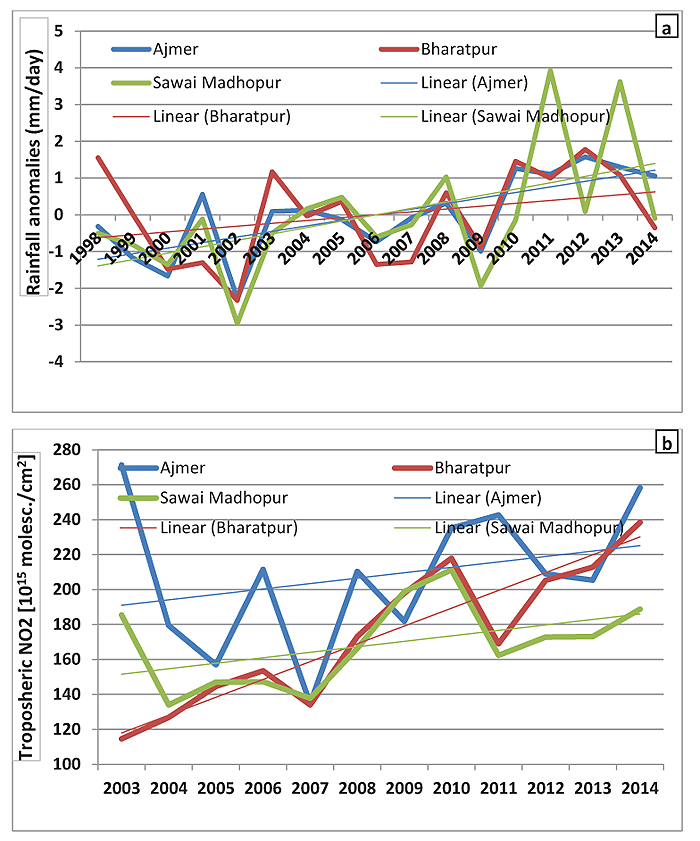
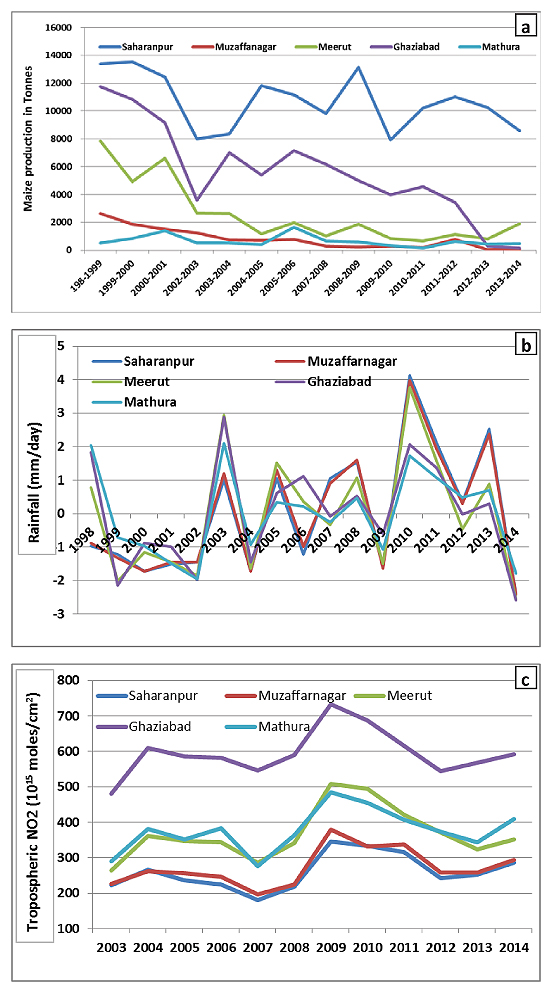
We selected three major cities from Rajasthan state, Ajmer, Bharatpur and Sawai Madhopur to analyze rice production (Figs. 8a to c) and its relation to rainfall and NO2 emission (Figs. 9a and 9b). Next, five cities, Saharanpur, Muzaffarnagar, Meerut, Ghaziabad and Mathura were selected from Uttar Pradesh state for Maize crop yield (Figs. 10a to c). On these locations, the emitted gas (here NO2) showed an increase trend while crop production showed a decrease (Fig. 10). Future projections for the production of maize are a bit problematic over Indian region (Deyyng et al. 2014), keeping in mind that rice crop needs more water than other crops like wheat, millet etc. Surprisingly monsoonal rainfall is continuously showing increasing trends over these cities (Fig. 7r). It is evident from the line graph that the production of rice is not regularly decreasing. It shows annual variations. Ajmer and Sawai Madhopur show a negative correlation between rainfall and tropospheric NO2 of -0.59 and 0.14, respectively, while Bharatpur shows a positive correlation of 0.32. One of the plausible reasons may be the crop yield which is decreasing due to increase in greenhouse gases. Somehow the correlation between CO2 and rice crop has been very limited for the selected sites except for the correlation of -0.50 over Bharatpur. In the presence of CO2 basically, the crop yield should increase.
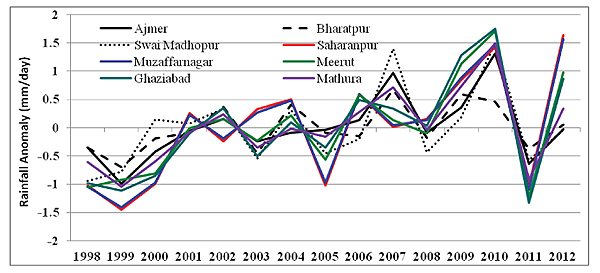
In another analysis, we attempted to analyse the dependency of maize production on rainfall and NO2 gas emissions. Over western Uttar Pradesh, the production of maize has decreased drastically while the rainfall and NO2 have shown an increasing trend. The correlations between rainfall and NO2 for these 5 locations of western Uttar Pradesh were observed to be very small except in the case of Mathura (-0.5). The linear correlation between NO2 and Maize production also seemed to be very low. Over the selected sites from north-west India, the production of rice and maize has reduced by ~40% and the increase in greenhouse gases was almost 5% from 1998 to 2011. The correlation between rainfall and maize production was observed to be a bit higher than rainfall and rice. Such kind of reduction in these food productions (Those are among regular foods of country-man in India), can bring social hardship and economical downsize of the country. An analysis of rainfall data from the historical experiment of HadGEM2-ES (from CMIP5) is shown in Fig. (11). The rainfall over these 8 selected regions shows the increasing trend from earth system model. How do farmers make use of and store monsoonal water for irrigation need, an extra thought to mull over?
4. DISCUSSIONS
One perspective of this finding may be due to change of farmer’s farming style because these crops require more care such as, protection against insects, heat waves, surface ozone and extreme rainfall events. No doubt, the major impact of the heat waves and the warmer temperature is during the reproductive stage of the crop, consequently, maize production reduces significantly (Hatfield and Prueger 2015). It may be suggested that modified/hybrid breed of rice, maize may tolerate the enhanced greenhouse gases and atmospheric warming which can produce more crop yield and have tolerance against greenhouse gases and rainfall deficiency. Further, the advancement than the regular practice, in the rice crop may reduce methane emission and hence crop yield for the larger population. The decrease in farming production may not be merely due to greenhouse gases emission and surface ozone, but, there may be some other reasons. No doubt the agriculture production may be affected by local factors e.g. extremely high temperature, droughts and prevalence of insects as well. The crop yield may increase through the genetically modified crop, which can sustain with changing climate and global warming in monsoonal Asia’s crop specific modeling or WRF-CHEM may provide a better understanding of how do emission of greenhouse gases, rainfall and crop production influence each other. In future research work, an attempt will be made to work with the inventories of CO2, NO2, CH4 and O3 on the Indian subcontinent and their impact on crop production.
Datasets acquired from the model pose the following caveats: coarser resolution, parameterization, resolution of gases in vertical column/layer of the atmosphere etc. After day-1, the model’s results started to deviate from reality. Satellite datasets are based on brightness, temperature or infrared sounders and are finally retrieved by an algorithm. In the presence of dense and towering clouds, satellite datasets experienced error in the measurement of various gases. All the datasets presented in this research work are global, so the general circulation in the chemistry model takes care of the transportation of the pollution and aerosols. Crop production datasets represent a point location in the northern Indian. Thus, the results may not represent and apply to the total region of northern India. Inherently, the results in the manuscript carry the limitation, uncertainties, and caveats of the datasets. The factor of the crop disease is not considered in this research while stating reduction in crop’s yields. To access such, factors, a crop model may provide better results.
CONCLUSION
The link between three entities rainfall, gas emission and crop yield is being established over selected sites of northwestern India. Over Indian region, the presence of CO2 seemed to be increased due to natural (ocean surface warming in Bay of Bengal, Arabian sea and Indian ocean; decomposition...etc.) and human sources (deforestation, emission from loads of traffics…etc.). In a separate analysis, it was found that the rainfall and greenhouse gases (e.g. NO2, CO2 and CH4) showed an increasing trend over the selected sites. Furthermore, with the increase of gas emissions (e.g. NO2, CO2 and CH4), there was a decrease in crop yield (production of rice and maize showed decreasing trends). This relationship has been established based on the correlation metric over the site-specific datasets of rainfall, greenhouse gases and crop production. In recent years, it has been found that the northern Indian region witnessed an increase in rainfall, whereas the production of rice and maize has reduced. Eight sites over north-western India showed reduction in the production of rice and maize by 40% together with an increase of CO2, NO2 and CH4 gas emission by 5% from 1998 to 2011.
CONSENT FOR PUBLICATION
Not Applicable.
CONFLICT OF INTEREST
The authors do not have any conflict of interest with any scientist in this field.
ACKNOWLEDGEMENTS
The authors are thankful to TEMIS, CMIP5, NCEP, TRMM and GrADS for their datasets and plotting packages available for research purposes.
REFERENCES
[CrossRef Link]
[CrossRef Link]
[CrossRef Link]
[CrossRef Link]
[CrossRef Link] [PubMed Link]
[CrossRef Link] [PubMed Link]
[CrossRef Link]
[CrossRef Link]
[CrossRef Link]
[CrossRef Link]
[CrossRef Link] [PubMed Link]
[CrossRef Link] [PubMed Link]
[CrossRef Link]
[CrossRef Link]
[CrossRef Link]
[CrossRef Link]
[CrossRef Link] [PubMed Link]
[CrossRef Link] [PubMed Link]
[CrossRef Link]
[CrossRef Link]
[CrossRef Link]
[CrossRef Link]
[CrossRef Link]

