All published articles of this journal are available on ScienceDirect.

Livelihood Vulnerability Associated with Forest Fire in Pauri-Garhwal, Western Himalaya
Abstract
Background:
The livelihood of mountainous communities of Himalayan region closely knotted with forest related activities. However, forest degradation especially forest fire significantly affects the mountainous livelihood and hence, there is an urgent need to describe, evaluate and understand specificity of mountainous areas to forest fire.
Methods:
In this view, a study on livelihood vulnerability with forest fire of High Altitude Zone (HAZ) and Low Altitude Zone (LAZ) was assessed with Livelihood Vulnerability Index (LVI). It uses 35 indicators, reduced to six components to create an overall index. Each component is composed of set of indicators and they are function of observable variables. The framework uses primary data and employs maximum-minimum normalization to restrict the value range of indicators between 0 to 1.
Results:
The value near to 0 shows lower vulnerability. The overall vulnerability of HAZ region is higher, that might be attributed to higher dependency on forest; live in proximity of forest; unstable socioeconomic condition; less infrastructural development and higher exposure to climatic extreme events.
Conclusion:
Therefore, the adaptive capacity of HAZ should be strengthened in a cross cutting manner for reducing livelihood vulnerability to forest fire. The sectors specific developmental policies/programmes should also be rationalized through bottom up adaptation planning with special reference to forest fire vulnerability.
1. INTRODUCTION
Forest is one of the most valuable terrestrial ecosystems that play a crucial role in maintaining environmental balance. It provides numerous goods and services, and maintains life support system essential for life on earth. Forests soak up carbon dioxide from the atmosphere offsetting anthropogenic emissions. Protecting forests, therefore, has a double-cooling effect, by reducing carbon emissions and by maintaining high levels of evaporation from the canopy (Dahal et al, 2009). However, forests are in great anthropogenic pressure due to the ever-increasing demand for forest products (Gulati and Sharma, 2000) and dependency of about 60 million forest dependents. (World Bank, 2006). The higher dependency of a larger section of rural population has an inhibitory effect on the productivity of forest. It has been estimated that more than 40% poor of the country are living in these forest fringe villages (MoEF, 2006). Thus, forest is a source of livelihood and providing opportunities for poverty reduction to a larger section of rural population (Sunderlin et al, 2005).
The anthropogenic pressure significantly increased the rate of deforestation and forest degradation (Mitra et al., 2013; Gurarni et al., 2010; Negi, 2009; Awasthi et al., 2013). One such reason is forest fire which has captured the attention worldwide due to the large-scale devastation in the forests of South East Asia, Amazon and the Rocky Mountains of the USA. Worldwide, forest fire is very common and frequent but in some case, it is devastating and destroys the forest at large scale. Such fires have not only led to threats to the biological diversity of these forests, but also cause large-scale suffering in neighboring lands (Narendran, 2001; CBD, 2001), herald ways for invasive species and modify the atmospheric concentration of gases (like GHG and aerosols) (Joshi et al., 2013) that lead to change in environmental variables (temperature, solar radiation and relative humidity). Thus, forest fires are considered to be a potential hazard with physical, biological, ecological and environmental consequences. In contrary to this, forest fire also has some beneficial impact on forest areas such as placid surface fire turns litter into massive nutrient contained ashes that nourish the soil and influence the healthy growth of annual herbs and grasses (Negi, 2007). But in long-term, it actually harms the soil dynamics and structure as fire drastically affects the soil properties due to hastily combustion of organic matter present on or near the soil surface.
The causes of forest fires have been both natural and anthropogenic (Kodandapani, 2001). However, more than 90% of all forest fires globally are started by intentional or unintentional human activities (Levine, 1999) like burning, over-grazing, felling, resin tapping, damage to trees/mortality, litter removal, etc. The natural cause of forest fire is also related to climatic conditions such as temperature, wind speed and direction, level of moisture in soil and atmosphere, duration of dry spells, the friction of bamboos and rolling of stone. Besides the different natural and human-induced responsive agents of a forest fire, the co-factors like forest composition, topography, aspect, altitude, inclination and soil type (Shank & Noorie, 1950) also liable for increasing intensity and frequency of fire up to certain extent.
In India, about 40% of the forests are degraded (Aggarwal et al., 2009, Bahuguna et al., 2004), 70% forest has no natural regeneration, 55% of the forest is prone to fire (MoEF, 2006) and 6% are prone to severe fire damage. The average annual tangible losses from forest fires in India have been moderately estimated at Rs 440 crores (US$ 107 million) (IFFN, 2002). India witnessed the most severe forest fires during the summer of 1995 in the hills of Uttarakhand and Himachal Pradesh in North West Himalaya. An area of 677,700 ha was affected by fires. The quantifiable timber loss was around Rs. 17.50 crores (US$ 43 million) (Parasar et al., 2014). Forest fire is very common in districts of Uttarakhand and 63.9% area is highly vulnerable to forest fire (Satendra and Kausik, 2014).
The livelihood of 1.6 billion people depends on the forest for a variety of goods (food, fodder, agriculture, housing, and an array of marketable minor forest produces) and services (amelioration of microclimate, water and air purification). Approximately 300 - 400 million people (MoEF, 2006) depend on forests directly for their survival, including about 60 million people of indigenous and tribal groups, who almost rely on forests. But the livelihood concerns of these millions of poor people living in and around forest contribute to forest degradation (Davidar et al., 2010; Tripathy et al., 2008; Arjunan et al., 2005; Sagar and Singh, 2004; Maikhuri et al., 2001; Silori and Mishra, 2001). The youngest mountain range of Himalaya is a source of livelihood to millions of people and is highly vulnerable stretch of the world. The vulnerability is further compounded due to its susceptibility to forest fires. The intensity and frequency of forest fire have been increased drastically due to large-scale expansion of pine forests in many areas of the Himalayas. In this region surface fire is very common but its prevailing terrain occasionally converts surface fire to crown fires. The crown fire often ascends and spreads from pine forest to adjacent oak forests which are economically valuable and ecologically important. In this region fire often exceeds 4-5 km2 with a recurrence rate of 2-5 years whilst 11% of forest faces annual fire (Negi, 2007). It is hard to find out any pine forest stand in this region without prior fire history. A study in Garhwal hills by Semwal (1996), reported that 63% of the total fire incidents were intentionally man-made and the remaining 37% were accidental.
The forest fires cause air pollution (Miranda et al., 2008), degrade quality of stream water (USGS, 2012), harm the soil dynamics and structure in long-term (Verma, 2012), threaten agriculture (Ladrach, 2009), augment erosion (Sharma et al., 2008; Kumar, 2010), degrade forest and spoil the aesthetics of an area. In totality, forest fire enhances the vulnerability of forest dependents or people living in the proximity of forest. The present study is designed to assess the vulnerability of communities due to forest fire living in proximity of forest in the Himalayan region with the help of index-based approach. The aim of the research is to fill an academic and policy demand for assessing the vulnerability of communities from forest fire through developing forest fire vulnerability index. The present methodological approach is intended to bridge the gap between community requirements and priorities at the micro level and policy processes at the macro level, with an emphasis on the fact that higher-level policy development and planning must be informed by lessons learned and insights gained at the local level. The proposed index based on bottom-up approach, aims to provide recommendations for setting priorities for action while helping to develop a robust, integrated model approach to increase resilience to natural as well as anthropogenic risks at local levels. The developed social vulnerability may also be adjusted with inputs of the existing biophysical vulnerability assessments to create holistic and integrated scrutiny of the potential impacts of a forest fire in the regional settings.
2. METHODOLOGY
2.1. Study Area and Sampling Strategies
The spatial focus of the study was Srinagar (600 mean sea level) and Tarkeshwer (1800 mean sea level) of Pauri Garhwal District, Uttarakhand. The district is situated in the central part of Garhwal Himalaya and western part of Himalayas and lies between 29°20′ N-30°15′N latitude and 78°10′E-79°20′E longitudes lie at an elevation of 1,650 m above sea level encompassing an area of 5,440 sq. km. (Rajwar 1993) (Fig. 1). According to the 2011 census, Pauri Garhwal district has a population of 687,271 (Male - 326,829 and Female - 360,442). The population density is 129 inhabitants per kilometer square which is much lower than the state (i.e. 189) (Census of India, 2011). The district has a sub-temperate to temperate climate, with mean monthly temperature ranges from 25°C to 30°C (maximum of 45°C in June and minimum of 1.3°C in January), average annual rainfall of 218 cm (90% receives during monsoon), and 54 to 63% of relative humidity with some snow in winter at the higher reaches.
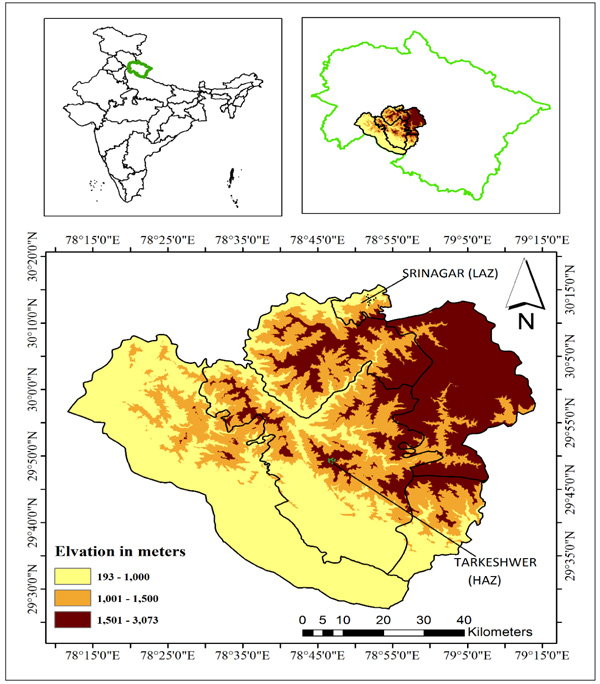
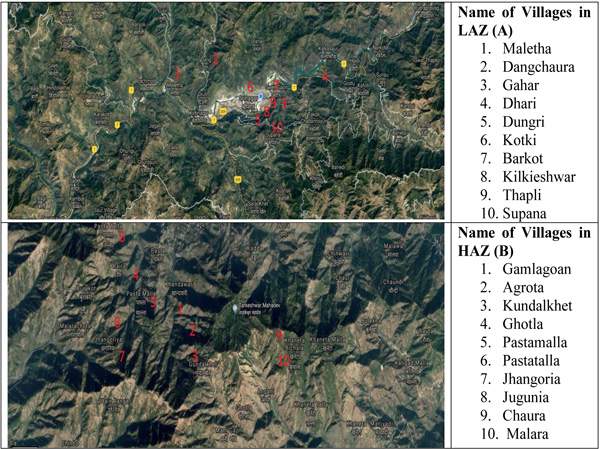
The districts of Uttrakhand located at hilly region are less developed in terms of infrastructure, i.e., electricity, roads and irrigation (Mittal et al., 2008). The study area is stratified on the basis of the infrastructure and developmental aspect. Being Tehsil (administrative division of the countries), the Low Altitudinal Zone (LAZ) should have more access to the infrastructural facilities and more opportunities to earn livelihood the High Altitudinal Zone (HAZ). Villages such as Maletha, Dangchaura, Gahar, Dhari, Dungri, Kotki, Barkot, Kilkieshwar, Thapli and Supana are under LAZ (Fig. 2A) and Gamlagoan, Agrota, Kundalkhet, Ghotla, Pastamalla, Pastatalla, Jhangoria, Jugunia, Chaura and Malara are under HAZ (Fig. 2B). Due to the mountainous setting, households are sparsely distributed in the remote area. Therefore, a minimum of five households were selected for the interview and if the number of households was less than five, all the households were selected from each village. The total number of respondents from LAZ and HAZ is 109 and 102, respectively. The interview was conducted from January 2016 to October 2016. Each household was interviewed thrice (Pre-fire season (January- February); Fire season (March-June) and Post-fire (July-October)). Interviews were conducted in Hindi language and Garwali (local dialect) by researchers themselves with the support of one local fellow. Generally, the head of the household was interviewed, but if s/he was not available, the spouse or elder member was interviewed. The interview was conducted through a questionnaire to avoid the disadvantages of secondary data and dependency on climate models. Discussions were held with peers and locals to gain sufficient knowledge about the prevailing livelihood mechanism and climatic fluctuation of the region. Each interview lasted on average of 30 min. The survey questionnaire was framed on the basis of components of Socio-demographic profile; Livelihood strategies and infrastructural facilities; Agriculture and food; Drinking water; Natural resources and Extreme event. Data were coded, cleaned and analysis was carried out using MS Excel and SPSS.
Source: Google Map.
2.2. Conceptual Framework
Livelihood Vulnerability Index (LVI) is a pragmatic approach to identify the significance of contributing factors to livelihood vulnerability forest fire at the local or community level. The index comprises a range of interacting dimensions of social, economic and natural factors. The dimension of livelihood was fabricated appropriately in the scientifically designed questionnaire. The survey questionnaire consisted of six broad sections: socio-demographic profile; agriculture and food; livelihood strategies and infrastructural development; natural resources and extreme event. The socio-demographic profile included information pertaining to lifestyle of mountainous people such as number of family member; education; house type and assets (movable - car, motorcycle, tractor, livestock, etc., and immovable – land, television, fridge, mobile phone, etc.), whereas information related to agriculture and food is gathered with the use of indicators like total land of household, agricultural assets, household’s food requirement and sufficiency throughout the year. To know the strategies of household against forest fire vulnerability, information like varieties of crop; introduction of new crop; change in sowing time; receive or seek assistance through social network; nearest bus stop and hospital, were collected. The data on collection of fodder and fuelwood, time spent and distance of forest were taken to address the status of natural resources. Further, the information on intensity and frequency of forest fire, stress, injury and death were also collected to analyze the impact of extreme events.
Each component was composed of a set of site-specific indicators. The indicators were chosen based on a review of literature data and preliminary field survey. They are case specific and may be of qualitative characteristics with the potentiality to be expressed as quantitative factors through the use of proxies as elaborated by Deems (2010). The indicators are aggregated into index, that was quantified (Primary data sources) under two categories, i.e. LAZ and HAZ. The proposed index is an effective assessment tool for a diverse set of users and it uses a simple approach to apply equal weights to all components. The similar approach has also been followed by Sullivan (2002), Vincent (2004), Hahn et al., (2009) and Pandey and Jha (2011). This weighting scheme could be adjusted by future users as needed.
| Components | Indicators | References |
|---|---|---|
| Socio-demographic profile | Household’s dependency index | Hahn et al. 2009, Pandey and Jha 2011 |
| House type diversity index | Sinha et al. 2015 | |
| Household’s decision index | Pandey and Jha 2011 | |
| Profession diversity index | Pandey and Jha 2011 | |
| Livestock diversity index | Hahn et al. 2009 | |
| Education index | Gerlitz et al. 2014 | |
| Electricity index | Joerin et al. 2014 | |
| Sanitation index | Madhury et al. 2014 | |
| Livelihood strategies and infrastructural facility | Agricultural crop variety index | Gerlitz et al. 2014 |
| New crop index | Pandey and Jha 2011 | |
| Sowing/planting time index | Hahn et al. 2009, Madhury et al. 2014 | |
| Assistance index | Joerin et al. 2014, Madhury et al. 2014 | |
| Market accessibility index | Gerlitz et al. 2014 | |
| Bus stop accessibility index | Gerlitz et al. 2014 | |
| Health care index | Hahn et al. 2009, Gerlitz et al. 2014 | |
| Agriculture and food | Agricultural land index | Gerlitz et al. 2014, Sinha et al. 2015 |
| Irrigated agricultural land index | Gerlitz et al. 2014, Sinha et al. 2015 | |
| Agricultural asset diversity index | ||
| Agriculture dependence index | Gerlitz et al. 2014, Madhury et al. 2014 | |
| Food sufficiency index | Hahn et al. 2009, Pandey and Jha 2011 | |
| Drinking water | Natural water utilization index | Madhury et al. 2014 |
| Natural water collection index | Pandey and Jha 2011, Gerlitz et al. 2014 | |
| Natural water degradation index | Hahn et al. 2009, Pandey and Jha 2011 | |
| Water supply index | Pandey and Jha 2011, Joerin et al. 2014 | |
| Natural resource | Fodder and fuel wood collection index | Pandey and Jha 2011 |
| Forest-based energy index | Madhury et al. 2014 | |
| Firewood collection index | Pandey and Jha 2011 | |
| Fodder collection index | Pandey and Jha 2011 | |
| Natural resources depletion index | Pandey and Jha 2011 | |
| Natural resource diversification index | Pandey and Jha 2011 | |
| Extreme event | Forest fire index | Joerin et al. 2014, Gerlitz et al. 2014 |
| Climate stress index | Pandey and Jha 2011, Gerlitz et al. 2014 | |
| Injury or new diseases | Pandey and Jha 2011, Gerlitz et al. 2014 | |
| Family death index | Pandey and Jha 2011, Gerlitz et al. 2014 |
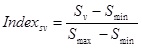
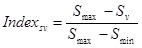
The details of parameters, collected from households as per defined methodology are reported in Table 1. A total of 35 indicators were selected for developing a vulnerability profile. They were in different units and scales and thus brought comparable levels through normalization on the basis of the functional relationship between the indicators and vulnerability. Two types of functional relationship were possible; vulnerability increases with increase in the value of the indicator, i.e. positive relationship (equation 1) and vulnerability decreases with increase in the value of indicator, i.e. negative relationship (equation 2). It is interpreted that higher the value of the indicator, more the vulnerability.
 |
(1) |
 |
(2) |
where:
Sv is the average value of indicator at respondent level;
Smin and Smax are the minimum and maximum values of indicator at the respondent level.
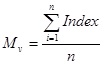
After normalization of each indicator, the components were averaged using equation 3 to calculate the value of each index.
 |
(3) |
where:
Mv is the one of the component;
Index is the indicator value of ith indicator;
n is the number of indicator in the index.
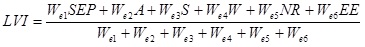
The indicators have been segregated into the six components. These were a socioeconomic profile (SEP), agriculture and food (A), livelihood strategies and infrastructural facility (S), drinking water (W), natural resources (NR) and extreme event (EE). Each indicator contributes equally to the overall index as also considered in other indexes such as Hahn et al. (2009), Pandey and Jha (2011) and Sinha et al. (2015). These components have been directly and indirectly; linearly and non-linearly related to the individual family’s inherent quality, resources availability and accessibility. The index for overall feasibility has been calculated as in equation 4:
 |
(4) |
where:
We1, We2, We3, We4, We5 and We6 are the number of indicators for LVI.
3. RESULTS AND DISCUSSION
The assessment of various components along with respective indicators and estimated value of LVI are reported in Tables 2 to 7. The results showed a varied response to LVI in LAZ and HAZ regions.
| Indicators | LAZ | HAZ |
|---|---|---|
| Household’s dependency index | 0.255 | 0.569 |
| Household’s decision index | 0.475 | 0.490 |
| House type diversity index | 0.305 | 0.632 |
| Profession diversity index | 0.775 | 0.781 |
| Livestock diversity index | 0.469 | 0.514 |
| Education index | 0.192 | 0.427 |
| Electricity index | 0.174 | 0.419 |
| Sanitation index | 0.322 | 0.812 |
3.1. Socioeconomic Profile
Forest is deliberately linked to day to day activities of mountainous people and it significantly contributes to the socioeconomic status of households (Shrestha and Gautam, 2014). The HAZ was more vulnerable as compared to LAZ in socioeconomic profile. The higher vulnerability in LAZ region might be attributed to larger family size, higher household dependency (0.569) along with less opportunity to work in different professions (0.632) (Table 2). However, the households of LAZ had the better educational background, more diversified livelihood opportunities and good income from different sources. The better educational background reinforces the decision-making ability of LAZ households and it strengthened the socioeconomic status of households.
In the rural Himalayan region, poverty is very high (Barua et al. 2013); a large proportion of households belong to BPL category and the majority of them possess small dwelling in sparsely distributed manner. In HAZ, possession of semi-concrete traditional dwelling is high, the wooden roof is generally used and is susceptible to fire. However, the possession of concrete dwellings in LAZ reduces the degree of damage during a forest fire and had lower vulnerability score as compared to HAZ (0.490) (Table 2).
Livestock rearing is traditional and closely linked to mountainous rural culture; more than 70% of the rural population of Uttarakhand Himalaya depends upon animals for their economic needs (Tiwari and Pande, 2011). The practice is common in HAZ and LAZ of Pauri Garhwal. Most of the household of HAZ possess 1 or 2 livestock but they were of the indigenous breed. This leads to low milk production and higher pressure on the forest for fodder. While, households of LAZ possess livestock of hybrid variety, that contributes to household’s income basket significantly. The possession of livestock is not directly correlated with forest fire but fodder shortage during forest fire considerably affects milk production in LAZ. Further, the shortage of fodder is a common phenomenon during a forest fire and hence alternate options such as availability of straw, cultivation of fodder, etc. are required. These practices are observed in LAZ (0.469) and hence are less vulnerable than HAZ (0.514) (Table 2).
Easy access to basic facilities such as sanitation and electricity strengthens the adaptive capacity in the rural areas. Sanitation facility is particularly crucial to build up preparedness to disaster and its lacking influences incidence of infectious diseases (Tol et al. 2007). The accessibility to toilet facility is very low in HAZ (0.812) region, however, the majority of households in LAZ (0.322), Table 2 possesses a toilet facility. In addition, access to electricity plays a crucial role in socioeconomic status and has implications for the health, education and income of communities. The access to electric facility is lower in HAZ (0.419); subsequently, the contribution of electricity in enhancing adaptive capacity is lower.
3.2. Livelihood Strategies and Infrastructural Facilities
Mountainous fragile settings are highly vulnerable to the extreme event (Sonesson and Messerli 2002). Therefore, it is necessary to adopt some additional strategies or mechanisms to cope up with the extreme event. The households of LAZ, as well as HAZ, adopted a number of strategies to minimize the impact of extreme event such as a change in crop variety, sowing and planting time, the introduction of new crop, and seek/obtain assistance from others. These activities do not enhance or reduce the impact of forest fire directly but play a crucial role in the adaptive capacity of villagers against hazards. The households in both regions introduced new crop variety (LAZ-0.110 and HAZ-0.103) (Table 3). after loss or effect of forest fire. The crop loss was slightly higher in LAZ (0.133) due to the shifting of traditional agricultural practice to modern. Although modern agricultural practice needs some technical support which is still lacking in LAZ. The agricultural strategies to cope the impact of forest fire are not enough for transforming the subsistence agriculture to surplus agriculture and hence mountain specific policy or programme is required for strengthening agriculture.
| Indicators | LAZ | HAZ |
|---|---|---|
| Agricultural crop variety index | 0.400 | 0.313 |
| New crop index | 0.110 | 0.103 |
| Sowing/planting time index | 0.233 | 0.161 |
| Assistance index | 0.500 | 0.443 |
| Market accessibility index | 0.121 | 0.315 |
| Bus stop accessibility index | 0.199 | 0.713 |
| Health care index | 0.299 | 0.672 |
| Bank accessibility index | 0.238 | 0.621 |
The villagers of both zones pursued or obtained help from the social network, e.g. relatives and neighbours, during extreme event specially forest fire. The households of LAZ (0.500) obtained assistance through social networks, on the other side lesser proportion of HAZ (0.443) households pursued assistance through social networks (Table 3). The higher vulnerability score of HAZ might be attributed to a weak network and widespread poverty. The LAZ was comparatively more developed in terms of infrastructural facilities and has better connectivity to district headquarter. These results in less time spent to reach the local market (0.121), bank (0.238) and hospital (0.299) (Table 3). The better accessibility to facility would strengthen the adaptive capacity and reduce the syn and post forest fire vulnerability.
3.3. Agriculture and Food
Agriculture is a minor land use in terms of spatial extent but has a significant influence on livelihood (Maikhuri et al., 2003). It is the culture of mountainous communities characterized by harsh climates and rough terrains. Moreover, it is one of the major sources of livelihoods in the Himalayan region and majority of the respondents solely dependent on agriculture for livelihood. Except a few, all of the respondents possess agricultural land and the land-holding ranged from 0.25 to 4 hectare. The agriculture of both regions is rainfed and hence the vulnerability score for irrigated agricultural land was almost similar. The households of LAZ (0.527) (Table 4) region have more agricultural assets but the agricultural practices especially orchards and rabi crop production are constrained by the incidence of forest fire. The forest fire also causes heating of neighbouring land that anguishes microbial growth (Dunn et al. 1985) and availability of nutrients/organic matter. Further, the increased soil temperature volatilizes the soil nutrients and favours the movement of smoke in soil that alters the chemical constituents of soil. Forest fire also causes burning on clay soils on slopes that tend to cause soil erosion (Mobley et al., 1973) and thereby siltation of damaging constituents in agricultural land and crop as well. In LAZ, vulnerability score for dependency on agriculture for food was 0.475 while it increased to 0.839 in HAZ. The less productive mountainous agriculture do not satisfy the food demand in HAZ (01) and LAZ (0.965), results in higher vulnerability score for food sufficiency (Table 4).
| Indicators | LAZ | HAZ |
|---|---|---|
| Agricultural land index | 0.213 | 0.222 |
| Irrigated agricultural land index | 0.455 | 0.414 |
| Agricultural asset diversity index | 0.527 | 0.748 |
| Agriculture dependence index | 0.475 | 0.839 |
| Food sufficiency index | 0.965 | 01 |
3.4. Drinking Water
The forest fires release a lot of carbon, suspended sediment, particulate organic matter and nutrients (Ranalli 2004, Pike et al., 2010) that also contaminate water. The degree of damage by using contaminated water positively correlated with dependency on it, higher the dependency more the damage. In HAZ, households were more dependent on the natural source of water as compared to LAZ and had the alternate option of drinking water such as motor pump and tanker. The better infrastructural facility lessens the time spent on water collection. The average time for water collection is 0.6 and 1.2 hours while the time increased to 0.7 and 1.4 hours during summer in LAZ (0.331) and HAZ (0.671), respectively (Table 5). The households of both zones reported that in the last five years, the average time for water collection has been increased and quantity of water at source is being deteriorated. A few households of HAZ also observed black shoot in the water and majority of them added that the taste of water is changed after forest fire and hence had higher vulnerability score (0.914). The deterioration in quantity of water causes water scarcity and increased the demand for water especially during summer. The water scarcity is more pronounced and frequent in HAZ (0.914) because of a higher dependency on natural sources of water. In addition, a large proportion of HAZ (0.932) households did not get a daily supply of potable water from Government. The local government supplies water, on an alternate day and it is increased to once in a week in summer. While LAZ (0.399) (Table 5) household showed lower vulnerability score for the supply of drinking water because most of the household get water supply on daily basis. Along with this, a few of them have a personal water source as observed during the survey.
| Indicators | LAZ | HAZ |
|---|---|---|
| Natural water utilization index | 0.200 | 0.824 |
| Natural water collection index | 0.331 | 0.671 |
| Natural water degradation index | 0.690 | 0.914 |
| Water supply index | 0.399 | 0.932 |
3.5. Natural Resources
Forests provide a wide range of goods and services that are vital for sustaining livelihood (Urothody and Larsen 2010). However, the livelihood concerns of millions of poor people living in and around forest contribute to forest degradation (Davidar et al. 2010, Tripathy et al. 2008, Arjunan et al. 2005, Sagar and Singh 2004, Maikhuri et al. 2001, Silori and Milaza 2001). Majority of households in the study area collects fodder and fuelwood from forest and collection is higher in HAZ (0.697) and is more vulnerable to LAZ (0.444) (Table 6). The degradation or losses significantly affects the stability of forests and thus forests are unable to satisfy the needs of local people. The shortage of fuelwood is one of the common problems amongst the forest dependents and it augments forest degradation in Himalaya. The fodder and fuelwood collection is constrained by the incidence of a forest fire, especially during summer. It is difficult to collect fuelwood during monsoon due to more undestroyed vegetation and wild animals and hence, households of both the zone collects fuelwood especially during summer and store it for next season i.e. monsson. Hence, the vulnerability score for fodder and fuelwood collection was higher in HAZ, the region also lacks alternatives for fodder and fuelwood. In HAZ, majority of household used forest-based energy for cooking purpose and only a few uses other alternatives like LPG and kerosene stove. While the households of LAZ (0.691) were less dependent on forest-based energy and most of them possess alternative.
| Indicators | LAZ | HAZ |
|---|---|---|
| Fodder and fuelwood collection index | 0.444 | 0.697 |
| Forest-based energy index | 0.691 | 0.934 |
| Firewood collection index | 0.507 | 0.468 |
| Fodder collection index | 0.960 | 01 |
| Natural resources depletion index | 0.830 | 01 |
| Natural resource diversification index | 0.211 | 0.615 |
The increasing demand and unsustainable harvest of natural resources degrade the forest in both zones. Therefore, average time spent on the collection of fodder and fuelwood in both the zones increased to 5 to 6 hours/day from 2 to 3 hours/day. Further, HAZ households reported depletion of natural resources at the considerably higher rate. The distance from forest to the village is increasing continuously in the last 8 to 10 years. Along with this, the majority of them added that major cause of forest degradation in the Himalayan region is a forest fire. The intensity and frequency of forest fire are increased significantly in the last 7-8 years. In a Himalayan region, more than 90% of all forest fires are started by anthropogenic intentional or unintentional anthropogenic activities (Levine et al. 1999) like burning, over-grazing, felling, resin tapping, litter removal. The remaining 10% is attributed by natural factors such as temperature; wind speed and direction; level of moisture in soil and atmosphere; duration of dry spells; friction of bamboos and rolling of stones. Besides, the different natural and human-induced responsive agents, the co-factors like forest composition, topography, aspect, altitude, inclination and soil type (Shank and Noorie, 1950) also liable for increasing intensity and frequency of fire. The households of HAZ live in proximity of natural resources but the natural resource diversification was higher in LAZ (0.211) and had a lower vulnerability Table 6. The vulnerability of HAZ was further enhanced by less awareness towards the value of natural resources.
3.6. Extreme Events
The degree of association with the sensitive environment; geographic location and unique economic, political, and cultural characteristics of areas (McCarthy et al. 2001, Dolan and Walker 2003) accelerates the impact of extreme event. The Himalayan ecosystem is very fragile (Sonesson and Messerli 2002) and exposed to multiple hazards (Kohler and Maselli 2009). The HAZ and LAZ are vulnerable to forest fire, however, vulnerability is slightly higher in HAZ (0.939) Table 7. The higher vulnerability of HAZ might be attributed to higher dependency and proximity to forest. Vulnerability of the region is further aggravated by climatic variability (INCCA 2010) and higher susceptibility to forest fire (Negi, 2007). The change in rainfall and temperature relegates a lot of stress on the local people, especially on forest dependents. The vulnerability score due to climatic stress in both the zones showed almost similar response due to homogenous climatic (sub-temperate to temperate climate) and topographic setting. However, accessibility to health facilities is lower in HAZ and hence, reported higher vulnerability score. The extreme event begets injury, a new disease or even death of local people. The household of both regions reported injury or diseases but the loss is lesser in LAZ (0.765) than HAZ (0.875) Table 7.
| Indicators | LAZ | HAZ |
|---|---|---|
| Forest fire index | 0.835 | 0.939 |
| Climate stress index | 0.915 | 0.989 |
| Injury or new diseases index | 0.765 | 0.875 |
| Family death index | 0.050 | 0.122 |
CONCLUSION
People living in a rural area in the developing world are comparatively more vulnerable because of higher dependency on natural resources, widespread poverty, marginalization and less adaptation options. Moreover, poverty together with less diversified livelihood and illiteracy augments the vulnerability of mountainous rural communities. Therefore, the employment opportunity should be strengthened by inculcating livelihood diversification programme with the active involvement of Non-Government Organisations. Further education is the integral element for overall development and it lacks in HAZ. The quality education is significantly lacking in both the region. It should be made compulsory (at least up to intermediate) for all children. Higher literacy could also attribute to more diversification in livelihood opportunities, better decision making capability and lesser family dependency. It would strengthen the resilience of people to extreme events, especially during a forest fire.
The vulnerability of mountainous region is further augmented by higher dependency on agriculture for food. Although, mountainous agriculture is affected by a forest fire and exaggerated by a number of complexities. Therefore, promising technological intervention together with capacity building on agricultural techniques is required. Moreover, it should also be supported by governmental strategies like compensation for loss, distribution of improved seed, agricultural training or awareness, loan without interest and crop insurance. The mountainous region has always had either too much or too little water. Furthermore, proper supply of water is an essential constituent for facilitating adaptation. Therefore, watershed management at the micro level and pipeline supply of water should be encouraged.
Infrastructure in terms of communication, road network, bank, market and hospital facilitate adaptation in the rural communities. Strategies must be evolved to strengthen the basic requirements and facilities. In addition, the sustainable harvest of forest produce is being promoted. The rural poor should be compensated through payment/reward for ecosystem services for their activities that lead to mitigation. Vulnerability to extreme event in both regions especially forest fire could be reduced by strengthening fire-prevention measures in fire-prone areas. The improved scientific techniques for monitoring and detection should be incorporated. Moreover, suitable silvicultural practices and rehabilitation of burnt land with fast-growing should be considered as an integral element. Protection and rehabilitation can further be improved by the involvement of local people and dissemination of information about the impact of forest fire on livelihood is required.
CONSENT FOR PUBLICATION
Not Applicable.
CONFLICT OF INTEREST
The authors declare no conflict of interest, financial or otherwise.
ACKNOWLEDGEMENTS
Declared none.
REFERENCES
[CrossRef Link]
[CrossRef Link]
[CrossRef Link] [PubMed Link]
[CrossRef Link]
[CrossRef Link]
[CrossRef Link]
[CrossRef Link] [PubMed Link]
[CrossRef Link]
[CrossRef Link]
[CrossRef Link]
[CrossRef Link]
[CrossRef Link]
[CrossRef Link]
[CrossRef Link]
[CrossRef Link]
[CrossRef Link]
[CrossRef Link]
[CrossRef Link]

