All published articles of this journal are available on ScienceDirect.

Evaluation of Residual Chlorine Concentration in the Water Distribution Networks: An Analytical Study

Authors Info & Affiliations
Abstract
Introduction/Objective
Chlorine is considered one of the most important disinfectants due to its widespread availability and moderate cost in most regions of the world. The presence of chlorine in various water supply networks is crucial to ensuring water and sanitation. The aim of this research is to determine the residual chlorine concentration in the water distribution network of the Central Water Project in Baquba and in some of its affiliated areas across Diyala Governorate, Iraq. Five lines are selected within the distribution network, where each line supplies multiple areas, and each line is located in a specific direction within the project's regions. These areas are situated at different distances from the central water project to assess the presence of residual chlorine in drinking water within the permissible limits. The residual chlorine concentration is therefore measured, along with determining the concentrations of relative factors affecting residual chlorine, including the acidity, water temperature, turbidity, and electrical conductivity.
Methods
To achieve this aim, ninety water samples were collected during the study period from November 2022 to May 2023. Local maps were also created using a Geographical Information System (GIS) to determine the spatial distribution of the stations sampled across the five lines for physical and bacteriological examinations.
Results
The associated results indicated the existence of efficient chlorine management in some tested periods. However, the ends of the distribution lines introduce a clear challenge of maintaining consistent residual chlorine concentrations. Essential parameters like distance from chlorine sources, temperature, pH, turbidity, and old pipe infrastructure have worsened the reduction of chlorine, emphasizing the need for enhanced water quality management in the distribution network.
Discussion
The results indicate that while residual chlorine levels can be effectively managed near chlorine sources during certain periods, maintaining stable disinfection actions at the ends of distribution lines remains a persistent challenge. The realised effects of main factors such as temperature, pH, turbidity, distance, and aged pipe infrastructure suggest that chlorine decay is not driven by uniform conditions across the network. This, in turn, underscores the need for more proactive, adaptive water quality management strategies, such as enhanced monitoring, targeted dosing, and infrastructure-focused interventions, to ensure reliable microbial control throughout the distribution system, not only at upstream locations.
Conclusion
The research indicated that the most polluted areas in Baquba City, Iraq, particularly lines 3, 4, and 5, suffer from bacterial contamination due to zero residual chlorine levels.
1. INTRODUCTION
Water shortage poses a notable challenge even in developed countries, where guaranteeing reliable access to high-quality drinking water remains a chief goal for sustainable living. The effects of water shortage are progressively apparent throughout these areas, highlighting the vital role of enhanced water sources in supporting public health and economic stability. As emphasized by Al-Obaidi et al. (2022), water serves as an indispensable and dynamic resource fundamental to supporting life and boosting long-term environmental resilience.
The purpose of water supply distribution systems is to transport safe and clean water, which is also satisfactory in quantity and adequate in other parameters of odor, appearance, and taste. A noteworthy fraction of the world’s population utilises purified water for various purposes, including drinking, cooking, and personal and home hygiene. Due to rapid deterioration, the demand for sterilization has increased following the extensive environmental pollution caused by the struggle to control the biological features of water in rivers, lakes, and underground wells (Bharti et al., 2022).
Chlorine disinfection is widely used worldwide for sanitizing water and eliminating biological contaminants. This is due to chlorine's low cost, ease of application, and high effectiveness. Chlorine has the ability to retain its disinfection efficacy in water until it reaches the consumer (Zhang et al., 2021; Mazhar et al., 2020; Jefri et al., 2022). However, purified water released into the distribution system undergoes changes due to its travelling via pipes, reservoirs, and storage tanks. Bacteria may enter the distribution system due to ineffective water disinfection, failure to maintain a tolerable disinfection residual, irregular service, low pipeline water pressure, excessive network leakages, corrosion of parts, and insufficient sewage disposal (Wang et al., 2025). As stated by Potgieter et al. (2018), failure of water disinfection or poor residual maintenance of disinfection, irregular service, low water pressure in the pipeline, excessive network leakage, corrosion of parts, and inadequate sewage disposal can cause bacteria to enter the distribution system. Although these compounds are associated with long-term health risks, the main focus of water management in distribution networks remains on the maintenance of effective chlorine residuals to prevent immediate microbial regrowth.
Relevant published studies on the byproducts associated with chlorine disinfection revealed significant health risks linked to the process. This, in turn, would diminish enthusiasm for chlorine disinfection. In this regard, byproducts can form during chlorine disinfection, with trihalomethanes among the most important. These compounds are known to cause cancer and fertility disorders (Evans et al., 2020). The formation of these compounds can be influenced by a number of factors, including water source, total organic compound content in the water, chlorine dosage, reaction time, pH, treatment method, and temperature (Padhi et al., 2029; Kothe et al., 2024). In other words, the effectiveness of water disinfection can be affected by several parameters, including chlorine levels, turbidity, coliform bacteria levels, and organic compounds. Interestingly, the World Health Organization (WHO) specifies that turbidity in purified water must be within 5 NUT, and it is preferred to be within 1 NUT to ensure efficient chlorination. Also, it was noted that low water temperature can reduce chlorination time, while high pH values are associated with reduced chlorine efficacy. Karikari and Ampofo (2013) found that the treated water from the Kpong and Weija Treatment Plants meets the WHO drinking water standards. Nevertheless, the bacteriological quality of the water deteriorated between the plants and the distribution points, with elevated levels of indicator and pathogenic bacteria. This degradation might be attributed to insufficient disinfection residuals, the presence of biofilms, or accidental pollution from cracked pipes, installation, and repair activities.
In humid countries, Geldreich (2020) reported that free residual chlorine levels should range from 0.3 ppm to 1.2 ppm, with levels controlled to keep microbial counts below 100 and 500 per milliliter in the drinking water distribution system. Water temperatures between 25 and 35°C were found to be ideal for most microorganisms, as they increase the chlorine evaporation rate and diminish the hypochlorous acid equilibrium reaction (Khor et al., 2024). Hypochlorous acid (by-product) is the decomposed form of chlorine in water with strong killing ability against a wide spectrum of pathogens. However, an elevated temperature accelerates the rate of chlorine degradation and shifts the balance of hypochlorous acid, thereby decreasing the stability of hypochlorite through photodegradation processes (Amichi et al., 2024). Furthermore, Geldreich (2020) reported that heavy rainfall established annually at 1000 mm to 2000 mm would affect the operational consistency of the water treatment system. This researcher discussed the principles of the chlorination process and ascertained the residual free chlorine within the drinking water distribution system present on the Malaysian peninsula. Specifically, Geldreich (2020) indicated that the free chlorine at user points was somewhat higher than 0.3 ppm, that is, within the permissible limit of the WHO average of 0.2-0.5 ppm. However, the results indicated that the total coliform count exceeded the suggested level set by the Malaysian Water Association. Thus, the tap water at the intake point should not be utilised for drinking, and further management, including water purification and boiling, is necessary.
The chlorination of purified water in the water distribution units was practiced in several countries to combat waterborne diseases. This is a substantial disinfectant and bleaching agent to ensure the removal of odor, protect against algae regrowth, and prevent microbial regrowth (Hoko et al., 2021). Referring to the conducted studies in Iraq, Jadaan (2011) investigated the chlorine concentration in the Iraq-Tikrit water network. The researchers considered seven sites at diverse distances from the treatment network to collect the samples. The researchers indicated that the chlorine dosages are not within the technical values. Also, the researchers confirmed that the water temperature has a direct impact on the concentration of residual chlorine, which decreases with increasing water temperature.
A recent investigation was conducted by Rahaman et al. (2025) to assess how active the chlorination system is in a selected District Metered Area (DMA) of Dhaka by evaluating whether satisfactory residual chlorine is preserved along the distribution network over space and time under various operating conditions. The simulations indicated that more than 50% of pipes receive no chlorine. However, the addition of six additional injection points can increase the chlorine coverage to over 86% of pipes, signifying that EPANET program manuals can be utilised to enhance chlorination management and decrease risks linked to insufficient disinfection and chlorine by-products. Moreover, Ahmed et al. (2024) evaluated the microbiological and main physicochemical quality of drinking water produced by purification stations in Baghdad (Al-Karkh and Al-Rusafa) over seasonal variations. From six stations, water samples were collected monthly from June 2021 to July 2022 and analysed for microbial indicators (total bacterial count, total coliforms, fecal coliforms, and E. coli) and physical parameters (residual chlorine, pH, temperature, turbidity, and total hardness). Statistical analyses of ANOVA and Pearson correlation were employed to assess seasonal changes and associated relationships between studied parameters. The findings indicated that most physical parameters are within allowable limits. On top of this, residual chlorine concentrations were sometimes lower than 0.2 ppm, indicating insufficient disinfection in parts of the network. Microbiological quality was commonly satisfactory in Al-Karkh, with occasional contamination, while Al-Rusafa displayed noteworthy and recurrent microbial contamination, predominantly in summer and autumn, with increased coliforms and E. coli surpassing allowable limits. Strong negative correlations were observed between residual chlorine and microbial metrics, whereas temperature showed a positive correlation with bacterial growth. Accordingly, the results highlighted the need for enhanced water treatment, reliable disinfection, and network rehabilitation.
Geographic Information Systems (GIS) have emerged as a confident and indispensable framework for providing advanced solutions to complex water resource challenges at both local and regional levels (Rashed et al., 2024). Rabie et al. (2025) confirmed that GIS-based spatial modeling is essential for sustainable management of water distribution networks, permitting precise monitoring of water quality parameters and documentation of susceptible areas within the infrastructure.
Referring to the importance of ensuring a continuous supply of safe drinking water and maintaining sufficient residual chlorine concentrations to prevent microbial regrowth during the water's journey from the treatment plant to the end consumers, which persists as a vital engineering and public health concern in developing regions including Iraq, the current research intends to measure the concentration of residual chlorine in the drinking water of Baquba city center, besides investigating the influence of several essential physical parameters of water: pH, temperature, turbidity, and electrical conductivity (EC) on the residual chlorine concentration. Specifically, the Water Distribution Network in Baquba city faces significant operational pressure due to aging infrastructure and the varying quality of the source water of the Diyala River. More importantly, this research intends to assess the water quality and safety of drinking water by comparing the obtained results against the standards of Iraqi. In other words, this research aims to make sure that the percentage of remaining chlorine concentration in the pipes of the drinking water network is sufficient to kill disease-causing bacteria. Successfully, this research used the GIS tool to determine the places where bacterial contamination occurred due to the lack of residual chlorine. In order to systematically operationalize this objective, objective maps are organized based on water quality data. The established maps successfully present the drinking water quality based on the residual chlorine concentration throughout the selected lines of the distribution network.
The significance of the current research and its unique benefits can be distinguished in the following aspects from the existing literature:
(1) In contrast to previous published investigations, the current research delivers precise mapping of chlorine decay, particularly within the poor infrastructure of the city of Baquba.
(2) Using GIS-based inverse distance weighting (IDW) spatial interpolation, this research converts different monitoring data into dynamic “risk maps”. These maps visually link hydraulic dead ends to chlorine reduction zones, delivering a practical decision support tool for local water authorities.
(3) This research goes beyond the qualitative description by quantitatively assessing the integrated impact of high turbidity (up to 50 NTU) and dangerous seasonal temperature variations (semi-arid climate) on the chlorine demand, precisely tailored to the features of the Diyala River Basin.
(4) An exclusive contribution of this research is the microscopic clarification of water safety through the coexistence of total coliform bacteria and the absence of E. coli, which delivers a definite diagnosis of biofilm regrowth versus external contamination in aging pipe systems.
2. MATERIALS AND METHODS
2.1. Explanation of the Studied Area
The central Baquba water treatment plant is situated in the Al-Sawamarah area of Baquba, northwest of the city, and pumps drinking water to all regions of Baquba city. The water treatment plant started production in 1985. The design capacity of the water treatment plant is 75 million gallons/day, served by five ground tanks spread throughout the city. This project feeds about 450,000 people in the city of Baquba. This would signify the importance of the current research. The key source of water is the Khuraisan River, and the water is treated in the water treatment plant using chlorine gas. Five lines were selected from the pipes feeding the liquefaction network, as indicated in Table 1 and Fig. (1), representing the different sides of the areas fed by the central Baquba water project. Three points were selected along each line to collect and examine water samples every week throughout the study period from November 2022 to May 2023. The 90 water samples were collected from the sites using 2-liter plastic bottles after washing them twice with the sample water at each station. The plastic bottles were well sealed and transported to the laboratory for the required physical tests. All examinations were conducted in the central Baquba water project laboratory.
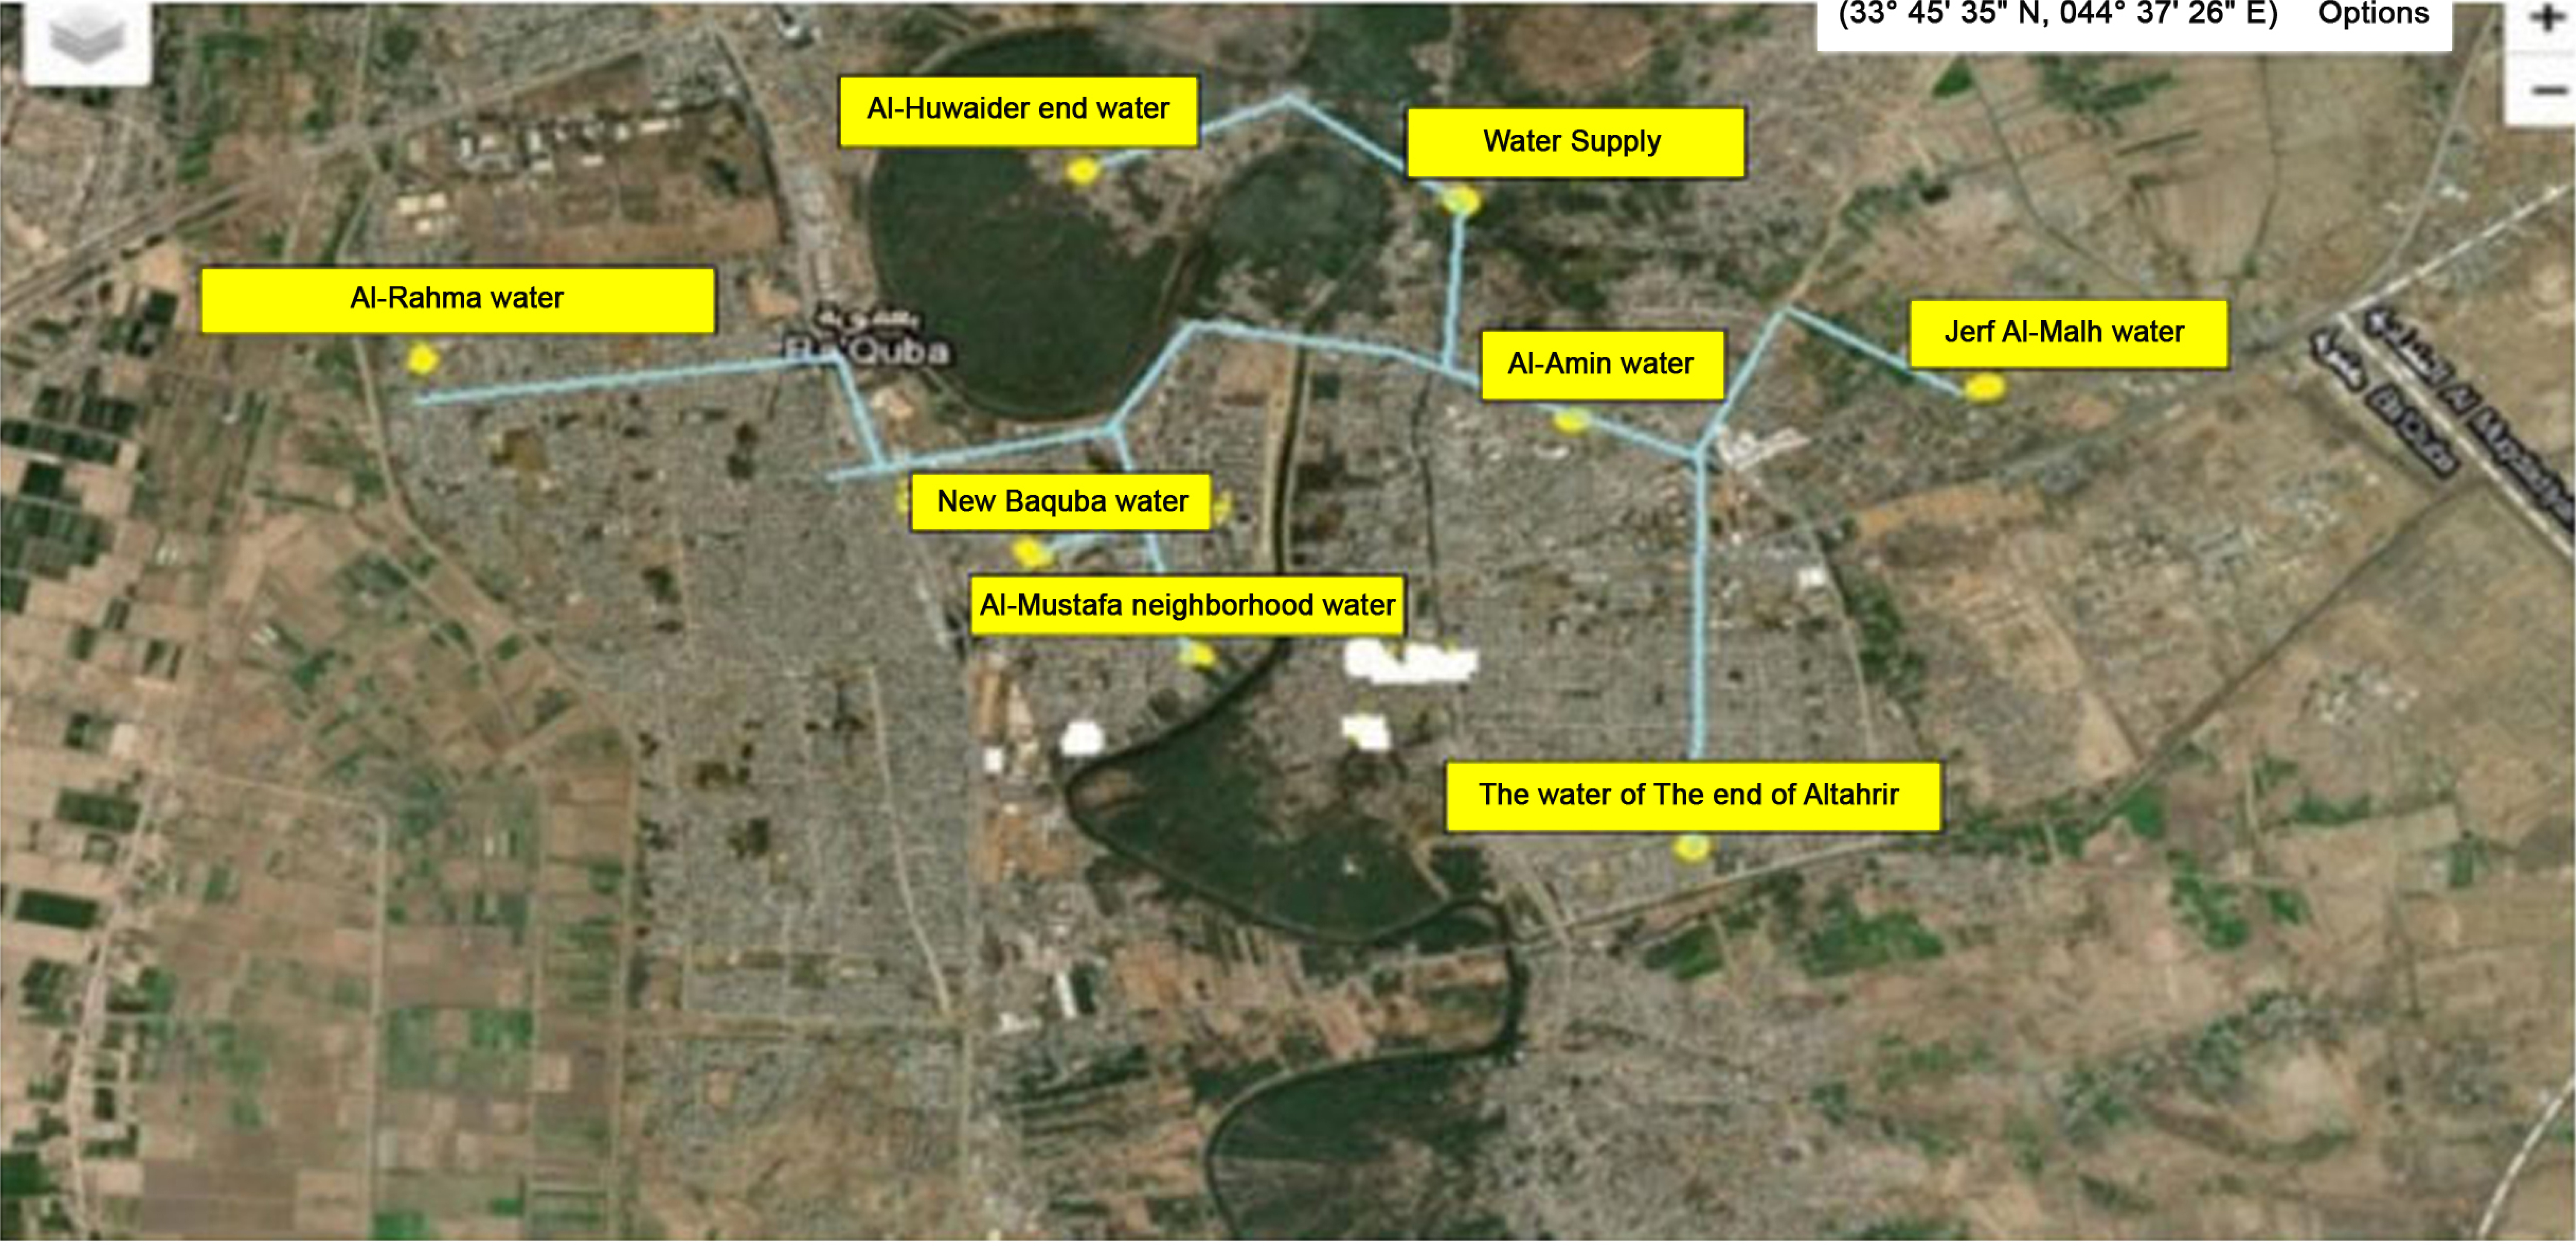
Baquba central water project and the inspected points along the selected five lines in the city of Baquba.
| Number of Pipelines of the Baquba Water Project | The Names of the Areas through which the Pipelines Existed |
|---|---|
| The first | Al-Wathba water - Al-Amin water - Jerf Al-Malh water |
| The second | Al-Jbenat water - Al-Huwaider water - Al-Huwaider end water |
| The third | Al-Wathba water - New Baquba water - Al-Mustafa neighborhood water |
| The fourth | Al-Wathba water - Al-Rahma water - Al-Aqsa Mosque water |
| The Fifth | Al-Wathba water - Al-Sikk water - The water at the end of Altahrir |
2.2. Water Quality Standards and Compliance Criteria
To certify a standardized evaluation of water quality throughout the Baquba distribution network, the projected parameters were contrasted with local and international benchmarks. Referring to the Iraqi drinking water standard (IQS 417) and World Health Organization (WHO) guidelines, Table 2 depicts the limit values of residual chlorine, turbidity, and associated microbial indicators. These limits serve as the chief basis to determine water quality.
| Parameter | Unit | WHO Guidelines | Iraqi Standard (IQS 417) | Location/Point of Sampling |
|---|---|---|---|---|
| Residual Chlorine | ppm | 0.2 - 0.5 (min) | 0.5 - 2.0 | Tap Water (Network End) |
| Residual Chlorine | ppm | 5.0 (max) | 2.0 - 3.0 | Finished Water (Plant Outlet) |
| Turbidity | NTU | < 5 | < 5 | Finished and Tap Water |
| Total Coliform | CFU/100ml | 0 (Must not be detectable) | 0 (Must not be detectable) | Finished and Tap Water |
| E. coli | CFU/100ml | 0 (Must not be detectable) | 0 (Must not be detectable) | Finished and Tap Water |
Based on Table 2, a residual chlorine concentration below 0.5 ppm in tap water is considered non-compliant, while turbidity beyond 5 NTU is categorized as a breach of local and international safety limits.
2.3. Sampling and Water Analysis
Ninety water samples were gathered from the drinking water network of the Baquba Central Project in several regions during the 7 months from November 2022 to May 2023. The physical examinations were conducted in the laboratory of the Baquba Central Water Project. Water samples were analysed to evaluate key physicochemical and biological parameters, including pH, electrical conductivity (EC), residual chlorine concentration, turbidity, and total coliform bacteria. Water analyses were achieved utilising the updated standard methods approved by the American Public Health Association (APHA) (APHA, 2005), ensuring high precision and compliance with international laboratory standards. The residual chlorine concentration was measured utilising a calibrated color comparator (Hach, USA). The device has a detection limit of 0.1 ppm. To guarantee the accuracy and reliability of the associated findings, the comparator was calibrated according to the manufacturer's instructions utilising standard chlorine solutions. Also, all measurements were conducted in duplicate to certify reproducibility, and the average values were considered for further analysis. The full descriptions of these examination methods are provided in the following subsections.
2.3.1. Turbidity
The property of turbidity was calculated utilising the German Turbidity meter after calibration using standard solutions supplied by the producer. The water samples were examined in a distinct tube provided with the device. The values are represented in Nephelometric Turbidity Units (N.T.U).
2.3.2. Electrical Conductivity
The CONSORTC 830 Multi-parameter analyser was utilised to calculate the electrical conductivity (E.C.) of the water samples after the required calibration. The results are represented in units of micro-Siemens /cm (μS).
2.3.3. pH
The pH of the water sample was measured using a pH meter from LOVIBOND, calibrated with Buffer solutions of pH 9, 7, and 4.
2.3.4. Residual Chlorine
The residual chlorine analysis followed the standardized field protocols established by LeChevallier et al. (1981) and authenticated by Mahmood (2018) for decentralized networks, deploying the Lovibond Comparator with DPD indicator—internationally recognized in APHA Standard Methods (23rd Edition, 3500-Cl) for on-site free chlorine measurement (APHA, 2005). Referring to this standard field procedure, Samples were collected in clean 2L plastic bottles rinsed twice with site water, capped immediately, and analysed within 2 hours at the Central Baquba Water Project laboratory to avoid volatilization, per APHA preservation guidelines (4°C storage if delayed) (APHA, 2005). Afterwards, a 10 mL water sample was treated with DPD reagent, demonstrating a specific pink solution. The color intensity, which is relative to the chlorine concentration, was matched to a color grade calibrated on a Lovibond disk. In turn, this would signify the concentration of the remaining chlorine in the water sample. This colorimetric method is documented for its consistency in delivering fast and precise measurements of free residual chlorine in decentralized water distribution networks, precise measurements of free residual chlorine in decentralized water distribution networks (Mahmood, 2018). More specifically, the DPD colorimetric technique attains a method detection limit (MDL) of 0.02 ppm and a quantitation limit (LOQ) of 0.1 ppm, with intra-day precision <5% RSD from triplicate field blanks and duplicates, guaranteeing consistent detection of chlorine decay. This robust QC framework certifies data integrity for the GIS risk mapping and Iraqi standard compliance evaluation, addressing the spatially variable infrastructure challenges unique to the aging distribution system of Baquba.
2.3.5. Bacteriological tests
The evaluation of total coliform bacteria and Escherichia coli (E. coli) was conducted using the well-known Most Probable Number (MPN) methodology for microbiological safety of water samples (LAKSHMI et al., 2025). In this multi-tube fermentation methodology, a total of 15 culture tubes were used for each water sample to provide a statistical estimate of the practical microorganisms and ensure compliance with international and national drinking water standards. Interestingly, this methodology remains a vigorous standard to capture fecal contamination indicators in complicated distribution networks with variable residual disinfectant levels. In this regard, five of these tubes comprised 10 ml of a double-strength Lauryl Tryptose Broth. However, the other ten comprised 10 ml of single-strength broth, each fitted with inverted Durham tubes. A sterile pipette was utilised to cautiously distribute 10 ml of the water sample into the first five tubes with double-strength broth. For the remaining ten tubes, 1 ml of the water sample was added to five tubes, and 0.1 ml to the other five, all containing single-strength broth. The tubes were then gently agitated to guarantee even distribution of the sample and were incubated at 37°C for 24 hours. After incubation, the cultures were tested for any signs of color change, demonstrating acid production or gas formation. For confirmation, a loopful of culture from tubes displaying gas production was transferred into a Brilliant Green Lactose Bile (BGLB) broth and incubated at 35°C for 24 to 48 hours. Tubes that exhibited both gas and growth were registered as positive for total coliforms (TC). A similar technique was enacted for fecal coliforms (FC), with the incubation temperature set at 44.5°C for both the presumptive and confirmatory steps. To distinguish E. coli, samples from FC-positive tubes were streaked onto an Eosin-Methylene Blue (EMB) agar plate and incubated at 37°C for 24 hours (Fiello et al., 2014). The presence of a metallic green sheen indicated the presence of E. coli.
2.4. GIS Modeling (IDW Technique)
GIS techniques can enable the integration and analysis of both spatial and non-spatial data at a given location (Madhu et al., 2023). This technique can be used to estimate water quality parameters at different locations where direct measurements are lacking, affording clear insights into the overall water quality within the studied area (Jha et al., 2020).
GIS has been established as a priceless resource for generating spatial distribution maps. This technique is indispensable across different domains, including engineering and environmental science, as it enables effective storage, visualization, and analysis of spatial information. The obtained maps can successfully demonstrate variations in concentrations of different chemical factors. Specifically, the Inverse Distance Weighting (IDW) interpolation technique in the ArcGIS Pro Spatial Analyst module was used to generate these distribution maps and thereby visualize variation in chlorine concentrations (Masoudi, 2021).
Following the methodological approach of Singh and Verma (2019), the current research used ArcGIS (version 10.8) for spatial interpolation, utilising the Sentinel-2 satellite image as the base map for the investigated area. To optimise this model, several power parameter values (p) were systematically evaluated based on cross-validation results. This analysis indicated that p = 4 yields the lowest root mean square error (RMSE) among the tested values. This, in turn, indicated high prediction precision and a minimum margin of error between measured and predicted values. Thus, p = 4 was approved for the final spatial analysis. Also, comprehensive cross-validation findings, including Mean Absolute Error (MAE) and RMSE, have been included in this research to confirm the consistency of the chlorine distribution maps.
3. RESULTS AND DISCUSSION
Table A.1 of Appendix A depicts the detailed results of chemical analysis of water samples collected from five selected lines for the tested period between November 2022 and May 2023. The average values are only presented for the three conducted tests of each property.
3.1. Water Temperature
The temperature of the water samples was measured in degrees Celsius, and the results are presented in Fig. (2). The water temperature ranges from 40°C, the highest recorded in the fifth line in June, to 10°C, the lowest recorded in the first line in March. A usual trend of a gradual increase in water temperature can be detected from November 2022 to May 2023. The fluctuated temperature between the selected five lines indicates a significant seasonal effect on water temperature variation. This fluctuation can undoubtedly affect the metabolic, physiological, and geochemical processes in the river water (Al-Obaidi et al., 2025).
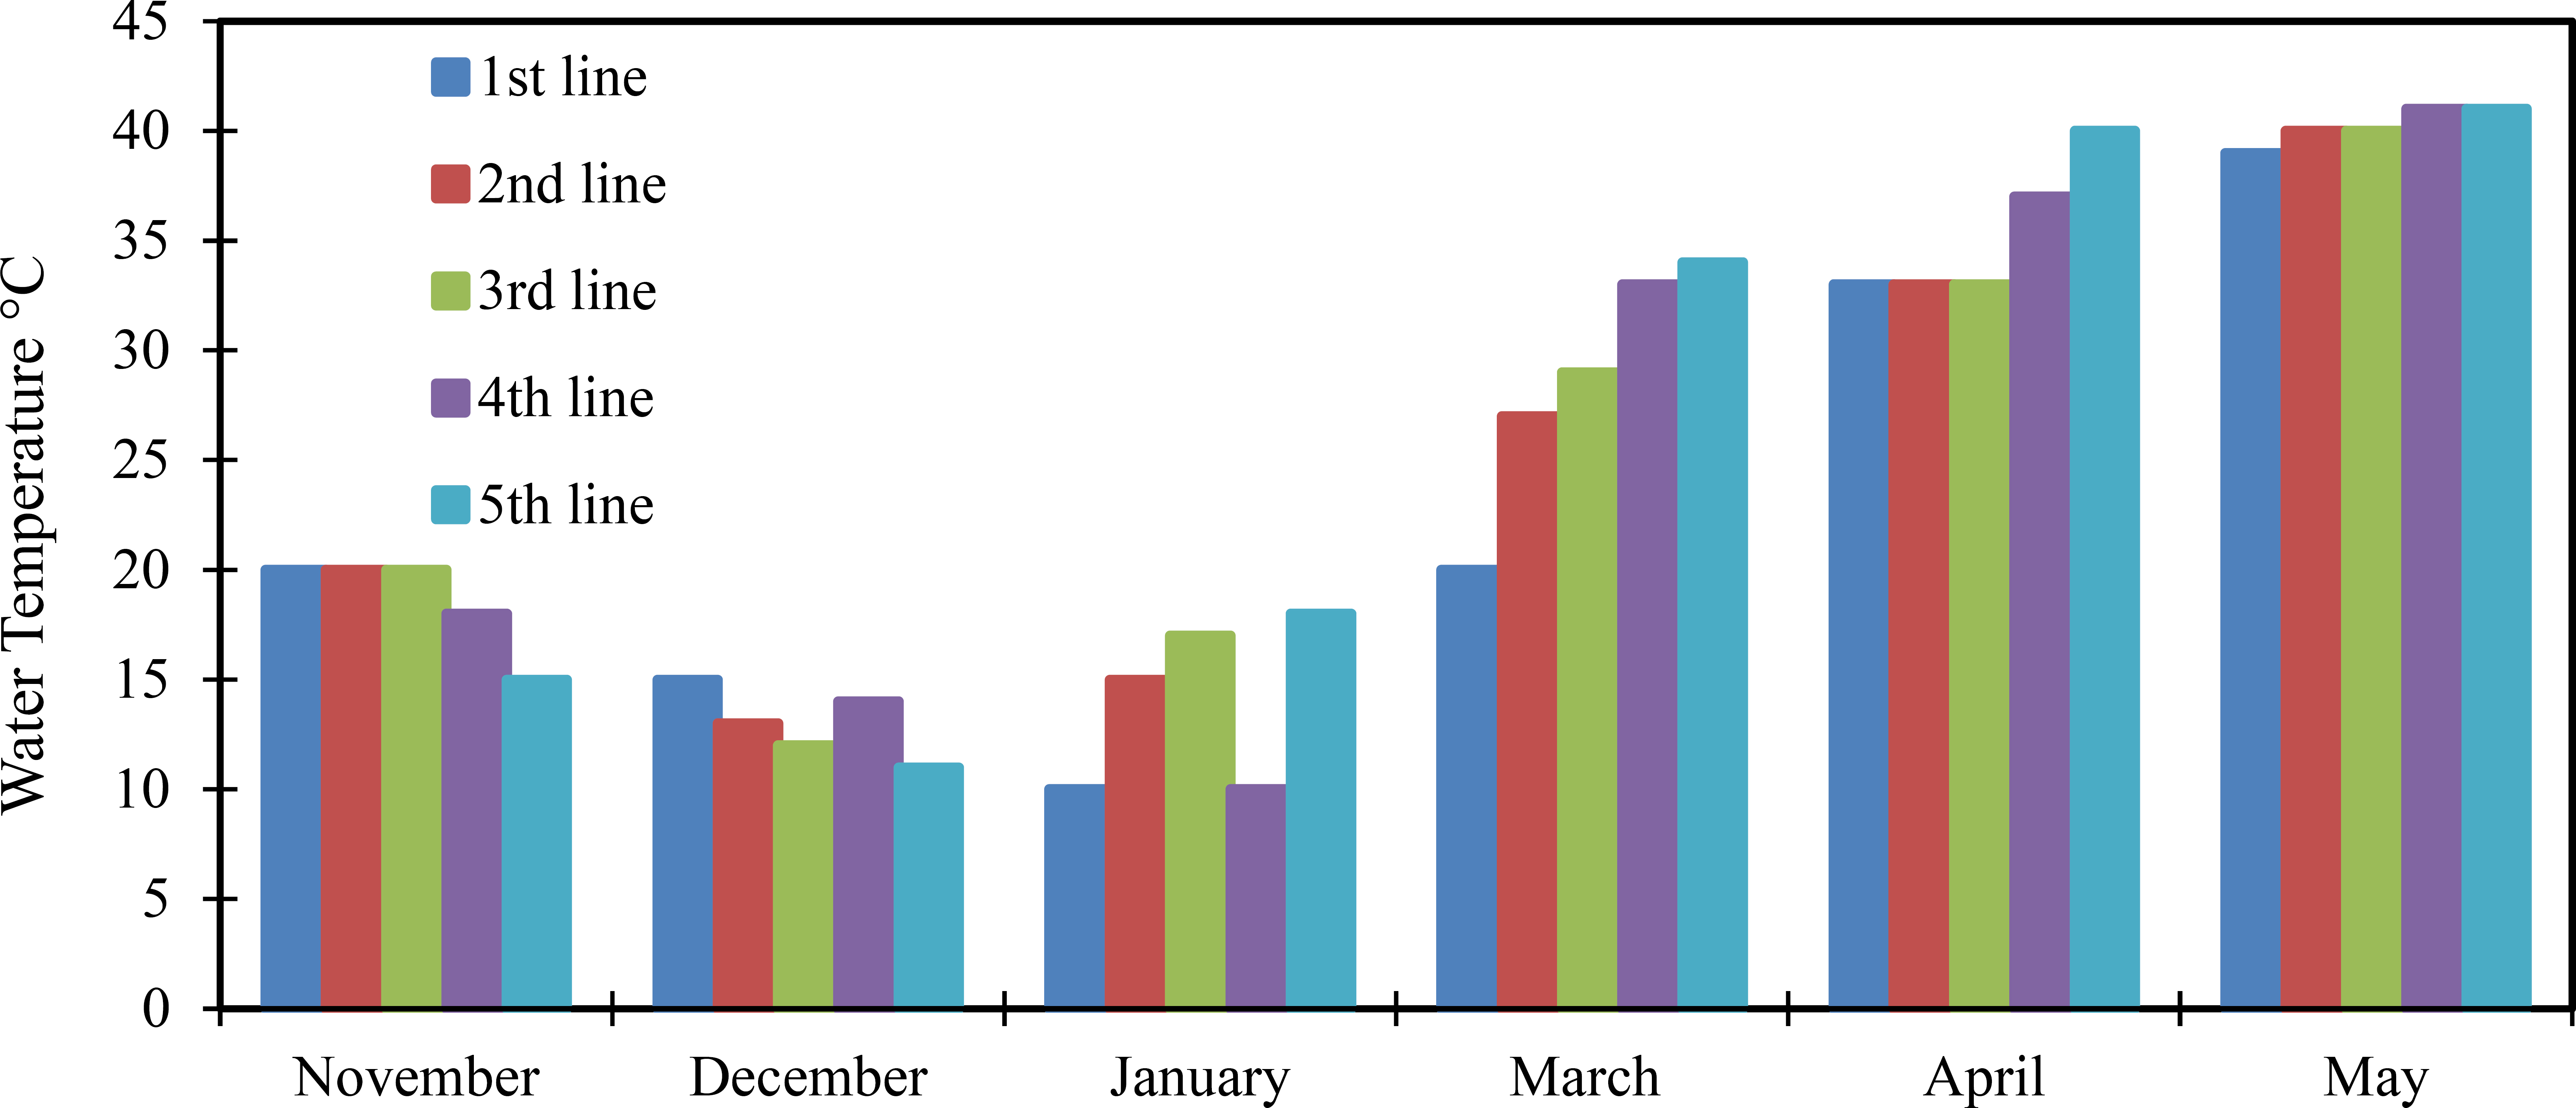
Temperatures of water samples for the five selected lines.
3.2. pH
The average pH results are shown in Fig. (3) and fall within the range of 6.8 to 7.8. This indicates a slightly alkaline nature of the collected water samples, which can be attributed to the limestone character of the Tigris River as it passes through several mountainous areas. More importantly, the pH values are within the WHO and Iraqi drinking water standards, which range from 6.5 to 8.5 (Khadim and Oleiwi, 2021). In particular, clarification and disinfection steps require controlling the pH to optimise the effectiveness of the water treatment. In this regard, the WHO recommends 8.0 to guarantee effective disinfection using chlorine.
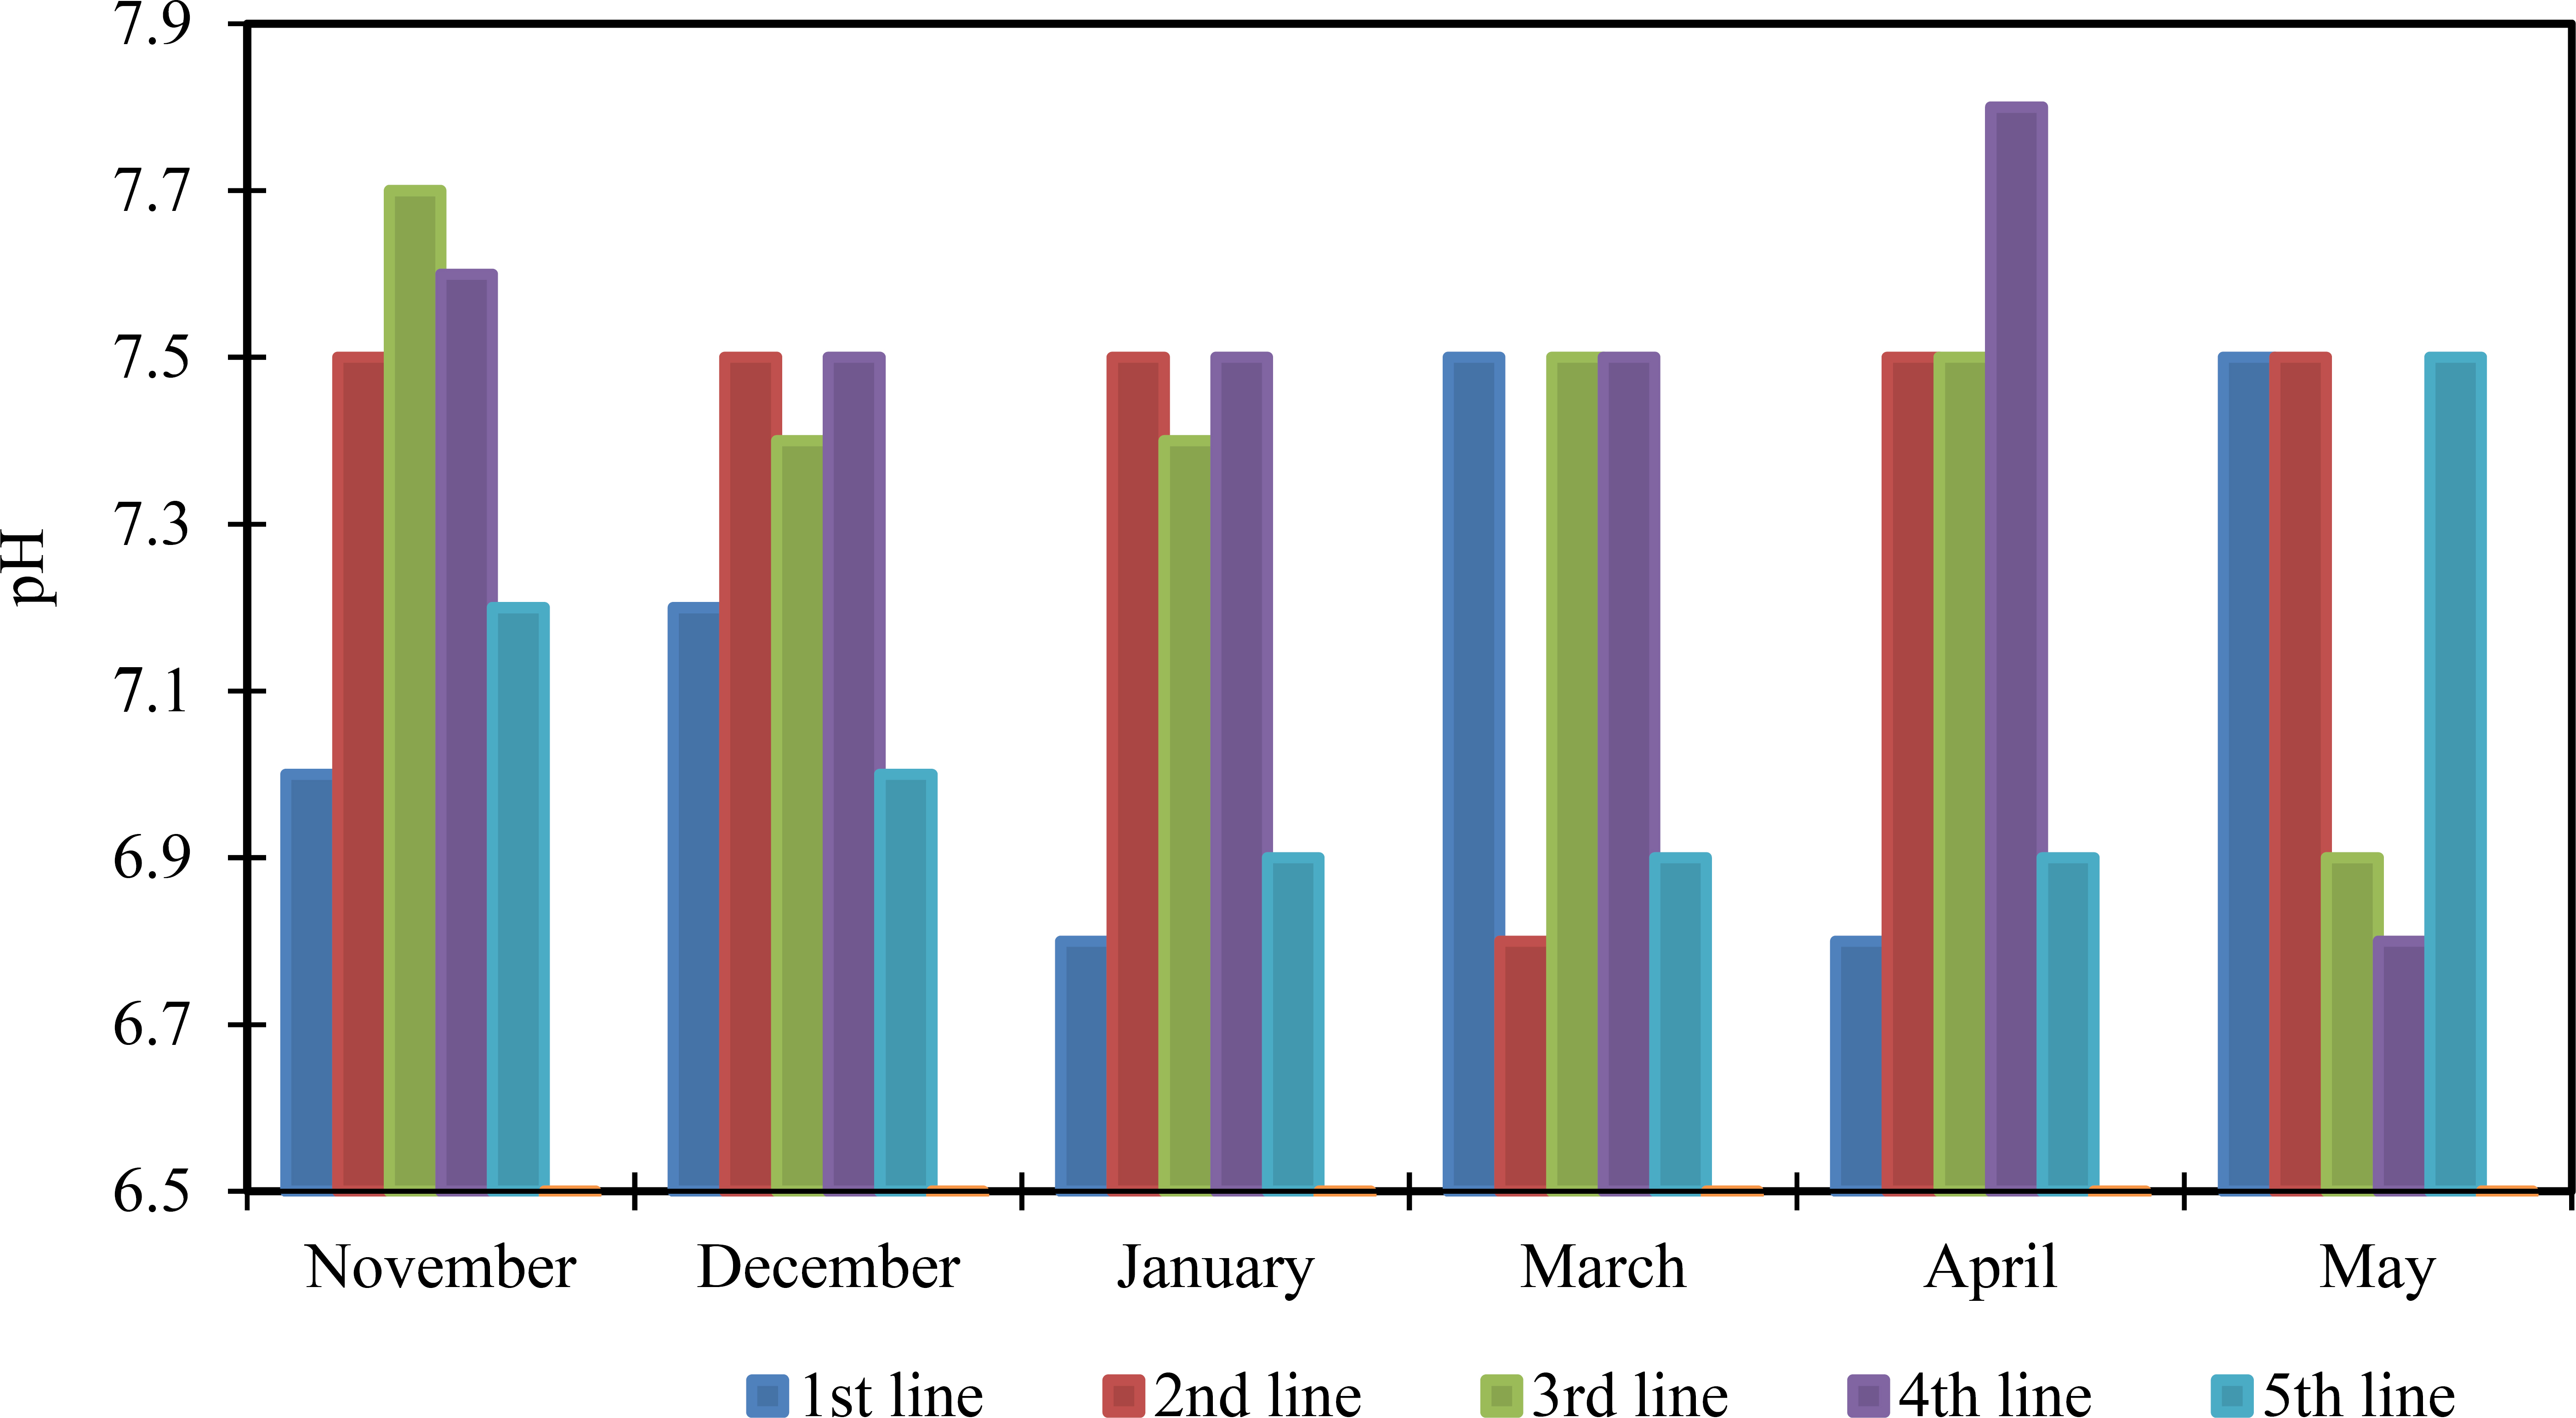
pH values of water samples collected from the five selected lines.
3.3. Turbidity
Turbidity is caused by various materials, including organic and inorganic matter, fine particles of soil and sand, and microorganisms. This can be expressed through the visual properties of light scattering or absorption rather than moving in a straight line. Turbidity is a measurement of water transparency for suspended solids and high levels of pathogenic organisms. High turbidity levels can shield living organisms from disinfection, so the treatment and disinfection processes must be effective enough to maintain turbidity at a minimum level. Based on the obtained results, the estimated turbidity values range from 4 to 50 NTU, as depicted in Fig. (4). These results are not within the global standards for drinking water. The high turbidity levels in the water samples during rainy seasons are attributed to mud, soil erosion, and suspended matter, including increased rainfall-driven organic matter and algae, flowing toward the river. This leads to increased turbidity in winter due to increased water level and movement, which prevents the settling of suspended matter. The lowest turbidity reading was recorded in the first line in November, while the highest turbidity reading of 50 was recorded in January, which was characterized by increased rainfall for the year 2023-2022.
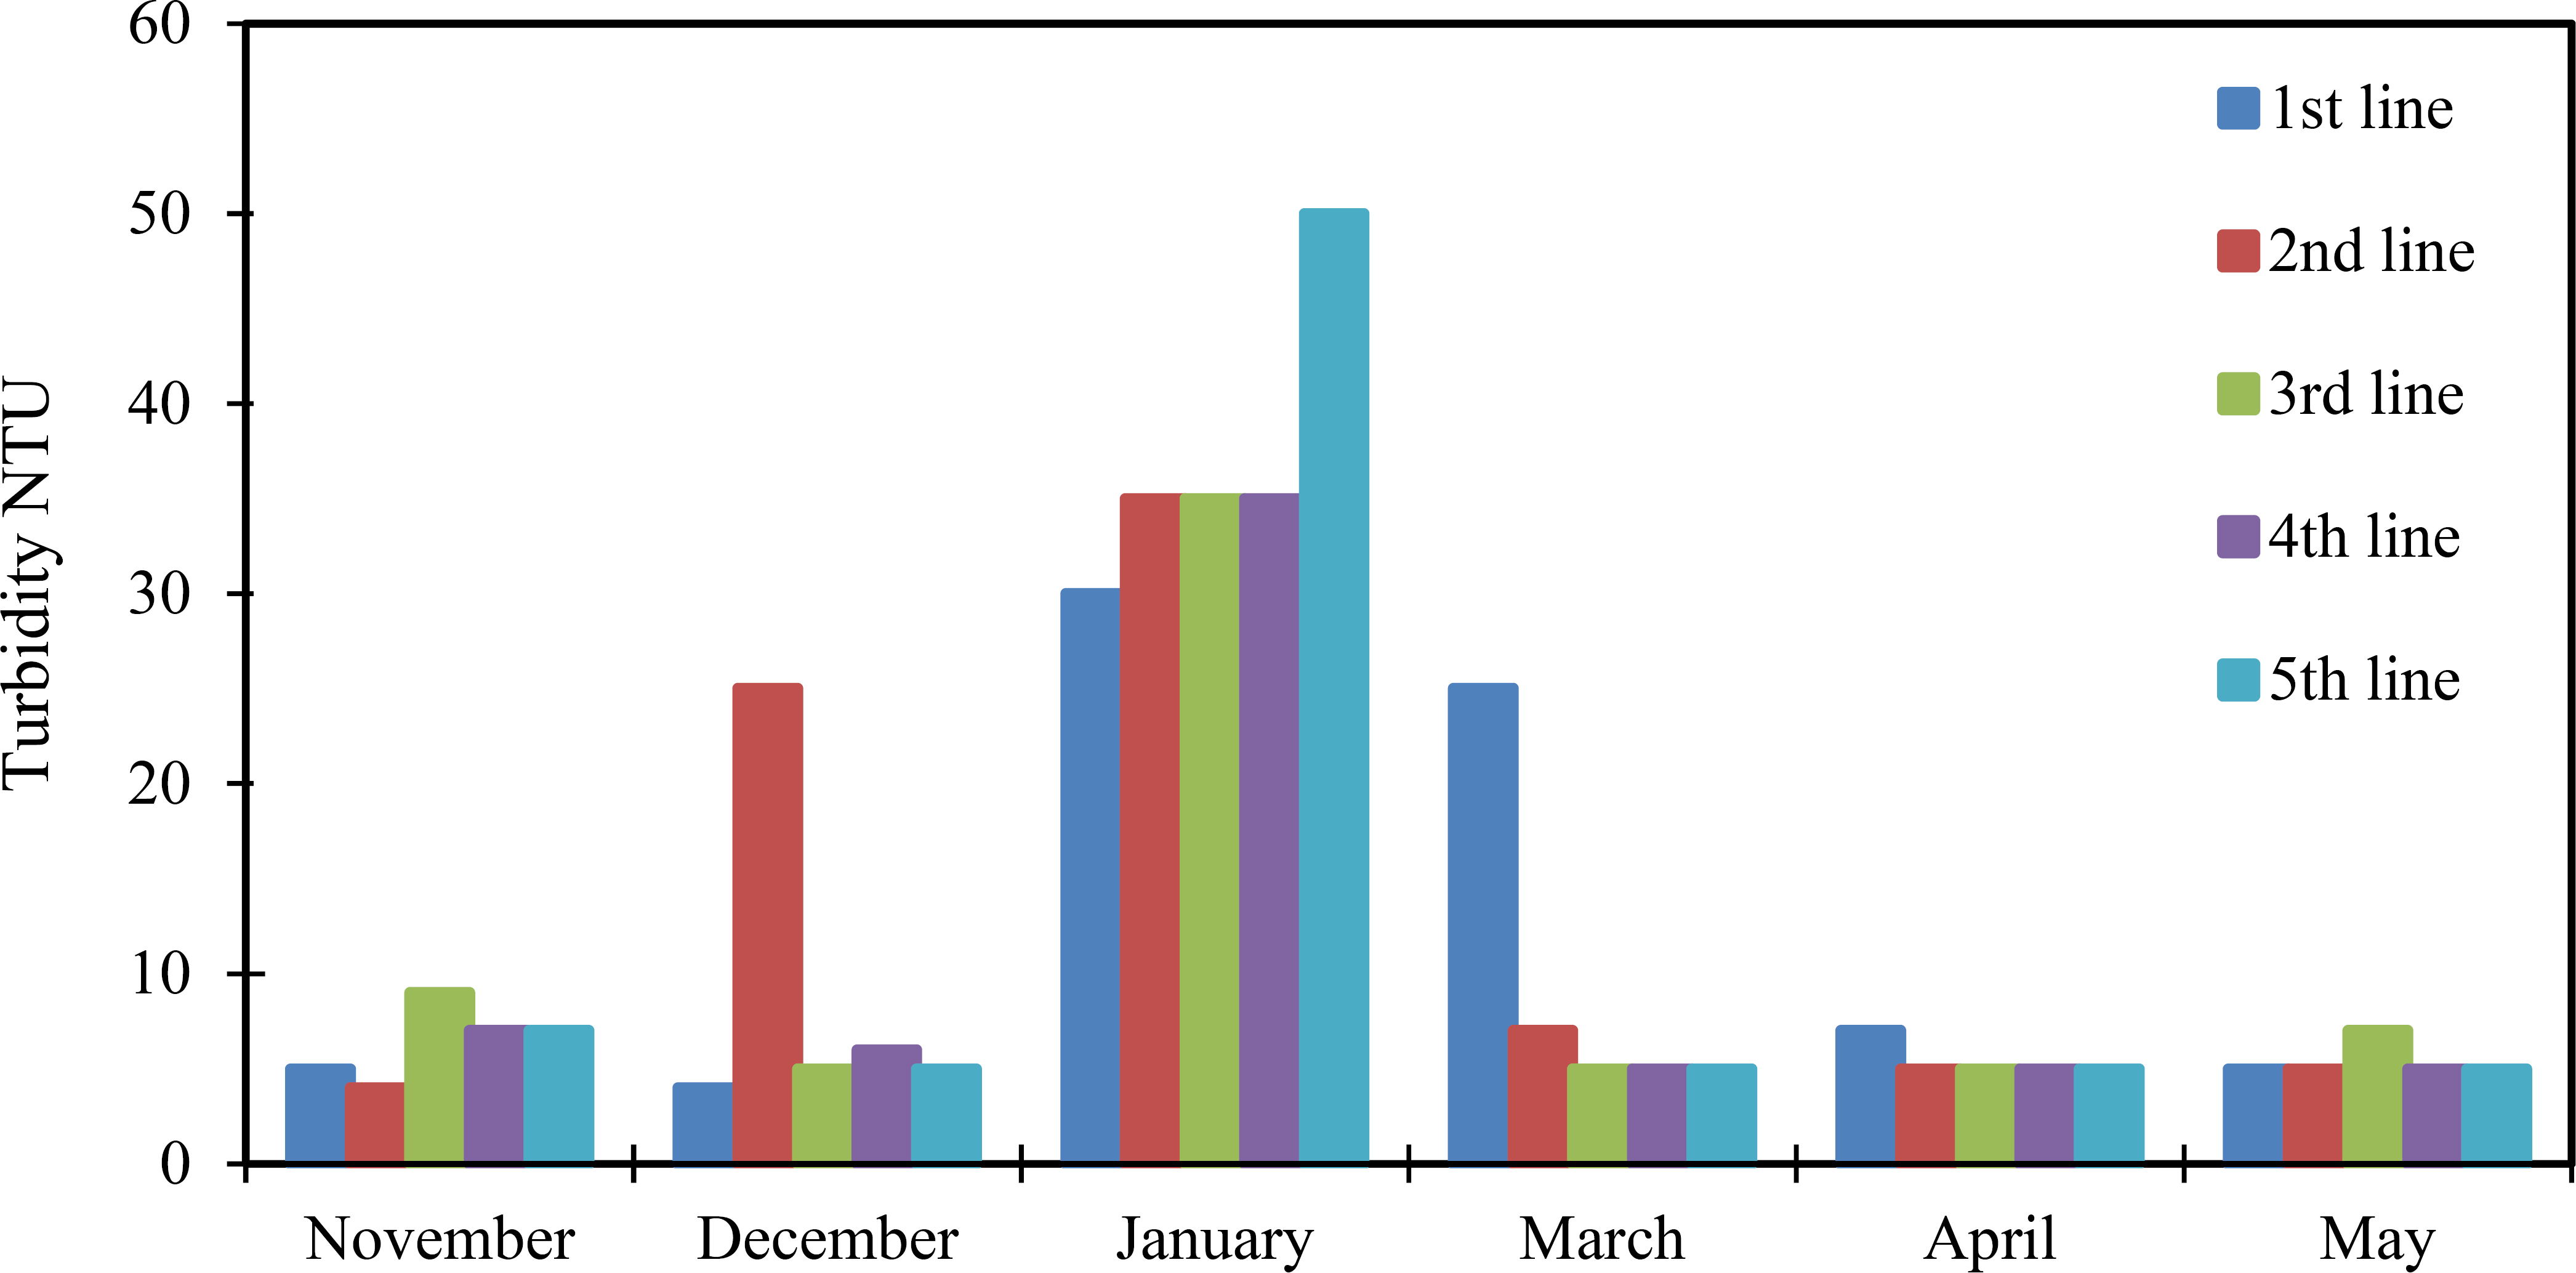
Turbidity of water samples collected from the five selected lines.
3.4. Electrical Conductivity
Electrical conductivity (E.C.) is an arithmetic expression of the negative and positive ions present in water. The E.C. of water is primarily contingent on the electrolytes, which are substances capable of being dissolved. Its value is affected by the concentrations of salt ions. The electrical conductivity of water ranged between 568 and 980 micro-Siemens per centimeter (μS/cm), as depicted in Fig. (5). The increase in the electrical conductivity (positively related to the concentration of dissolved salts in river water) coincides with seasonal variations, with higher values observed in winter compared to summer due to rainfall (Oleiwi et al., 2025). However, in the current study, the highest recorded reading is 980 μS/cm in April 2023, as the rainy season extended until May, resulting in increased river flow and a higher proportion of dissolved salts and consequently the electrical conductivity. The dissolved salts in water lead to a large amount of highly soluble carbon dioxide, which increases the concentration of negatively charged carbonate ions that associate with positively charged ions, forming non-homogeneous salts. All sample results throughout the study period complied with the Iraqi Standard No. 417 of 1989 and the WHO guidelines of 1993 (Galal-Gorchev, Ozolins, and Bonnefoy, 1993), which set the suitability of drinking water based on its E.C. not exceeding 2000 (μS/cm).
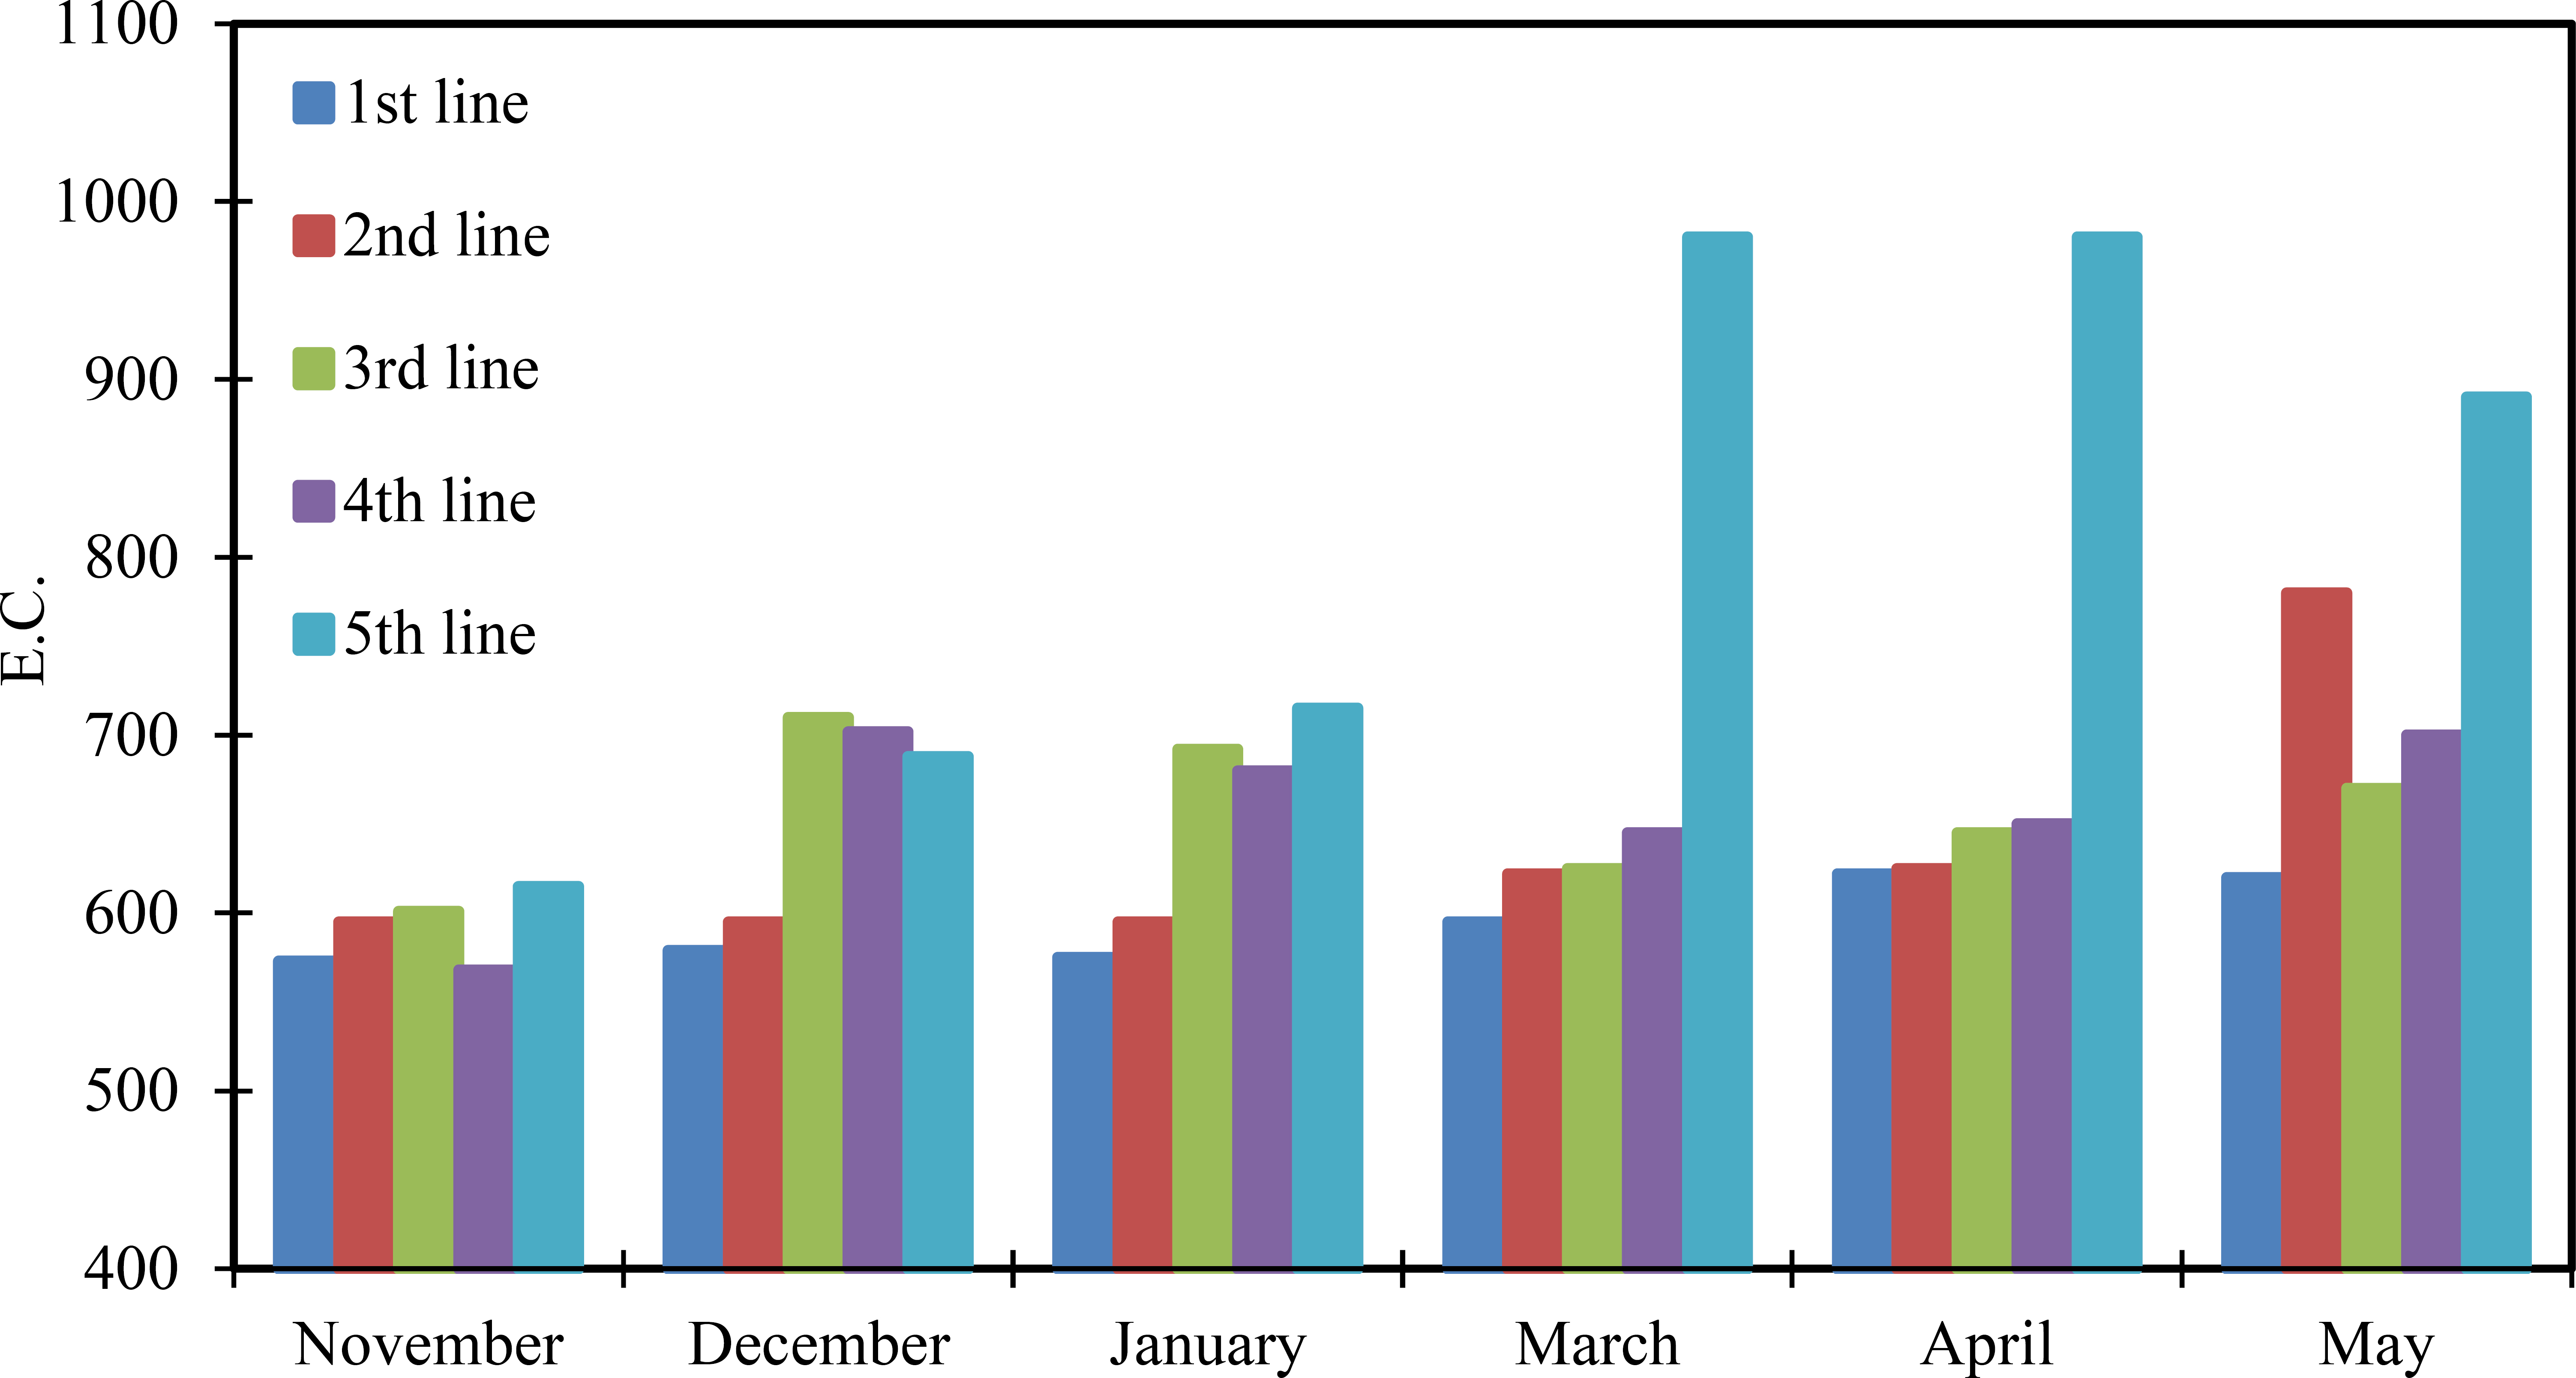
Electrical conductivity of water samples collected from the five lines.
3.5. Residual Chlorine
The key objective of having chlorine in water treatment plants is to ensure disinfected water and to exclude microorganisms that can cause disease. To ensure effective disinfection, chlorine is added in a sufficient amount. Chlorine gas is specifically added to the water treatment process after the filtration processes to kill microbes and ensure sterilization, and to eliminate a significant amount of organic compounds that can accompany chlorine and form toxic and carcinogenic substances. In this aspect, the chlorine should remain to prevent biological contamination of water during storage and transportation in the distribution network. The allowable free chlorine concentration at user points should be between 0.2 and 0.5 ppm (Geldreich, 2020). If the residual chlorine decreases, the likelihood of microbial contamination of water increases, especially in the event of leakage or malfunction in the water network. On the other hand, if chlorine levels increase, it can be dangerous due to the formation of compounds with organic substances that can have health effects. More importantly, the residual free chlorine after the water treatment plant disinfection process (plant outlet free-chlorine concentration) should be between 2.5 and 5 ppm in drinking water samples, as it would be degraded along the water network.
Figure 6 presents the results for residual chlorine in water samples collected from five lines from November 2022 until May 2023. This shows that the residual chlorine varies between 0 and 3 ppm. Indeed, a free chlorine level of zero can signal the sudden disappearance of residual chlorine, suggesting that the water is contaminated with large amounts of organic matter and that maintaining the residuals is difficult. The absence of chlorine in the distribution system indicates that the water requires high oxidation for the treatment of bacterial regrowth or the formation of biofilms. This could happen due to pipe breakage in the network and the mixing of drinking water with sewage. Figure 6 also shows that the highest residual chlorine concentration of 3 ppm occurred in December 2022 for the first line, compared to the lowest residual chlorine concentration across the different lines during the tested period. The observation of zero free chlorine levels at some sampling points is primarily attributed to increased demand for chlorine. In this regard, Fiello et al. (2014) reported that rapid disinfection depletion occurs when the reaction between chlorine and organic precursors exceeds the initial dose, leading to a complete loss of residual protection and increasing the risk of microbial spread in the distribution network.
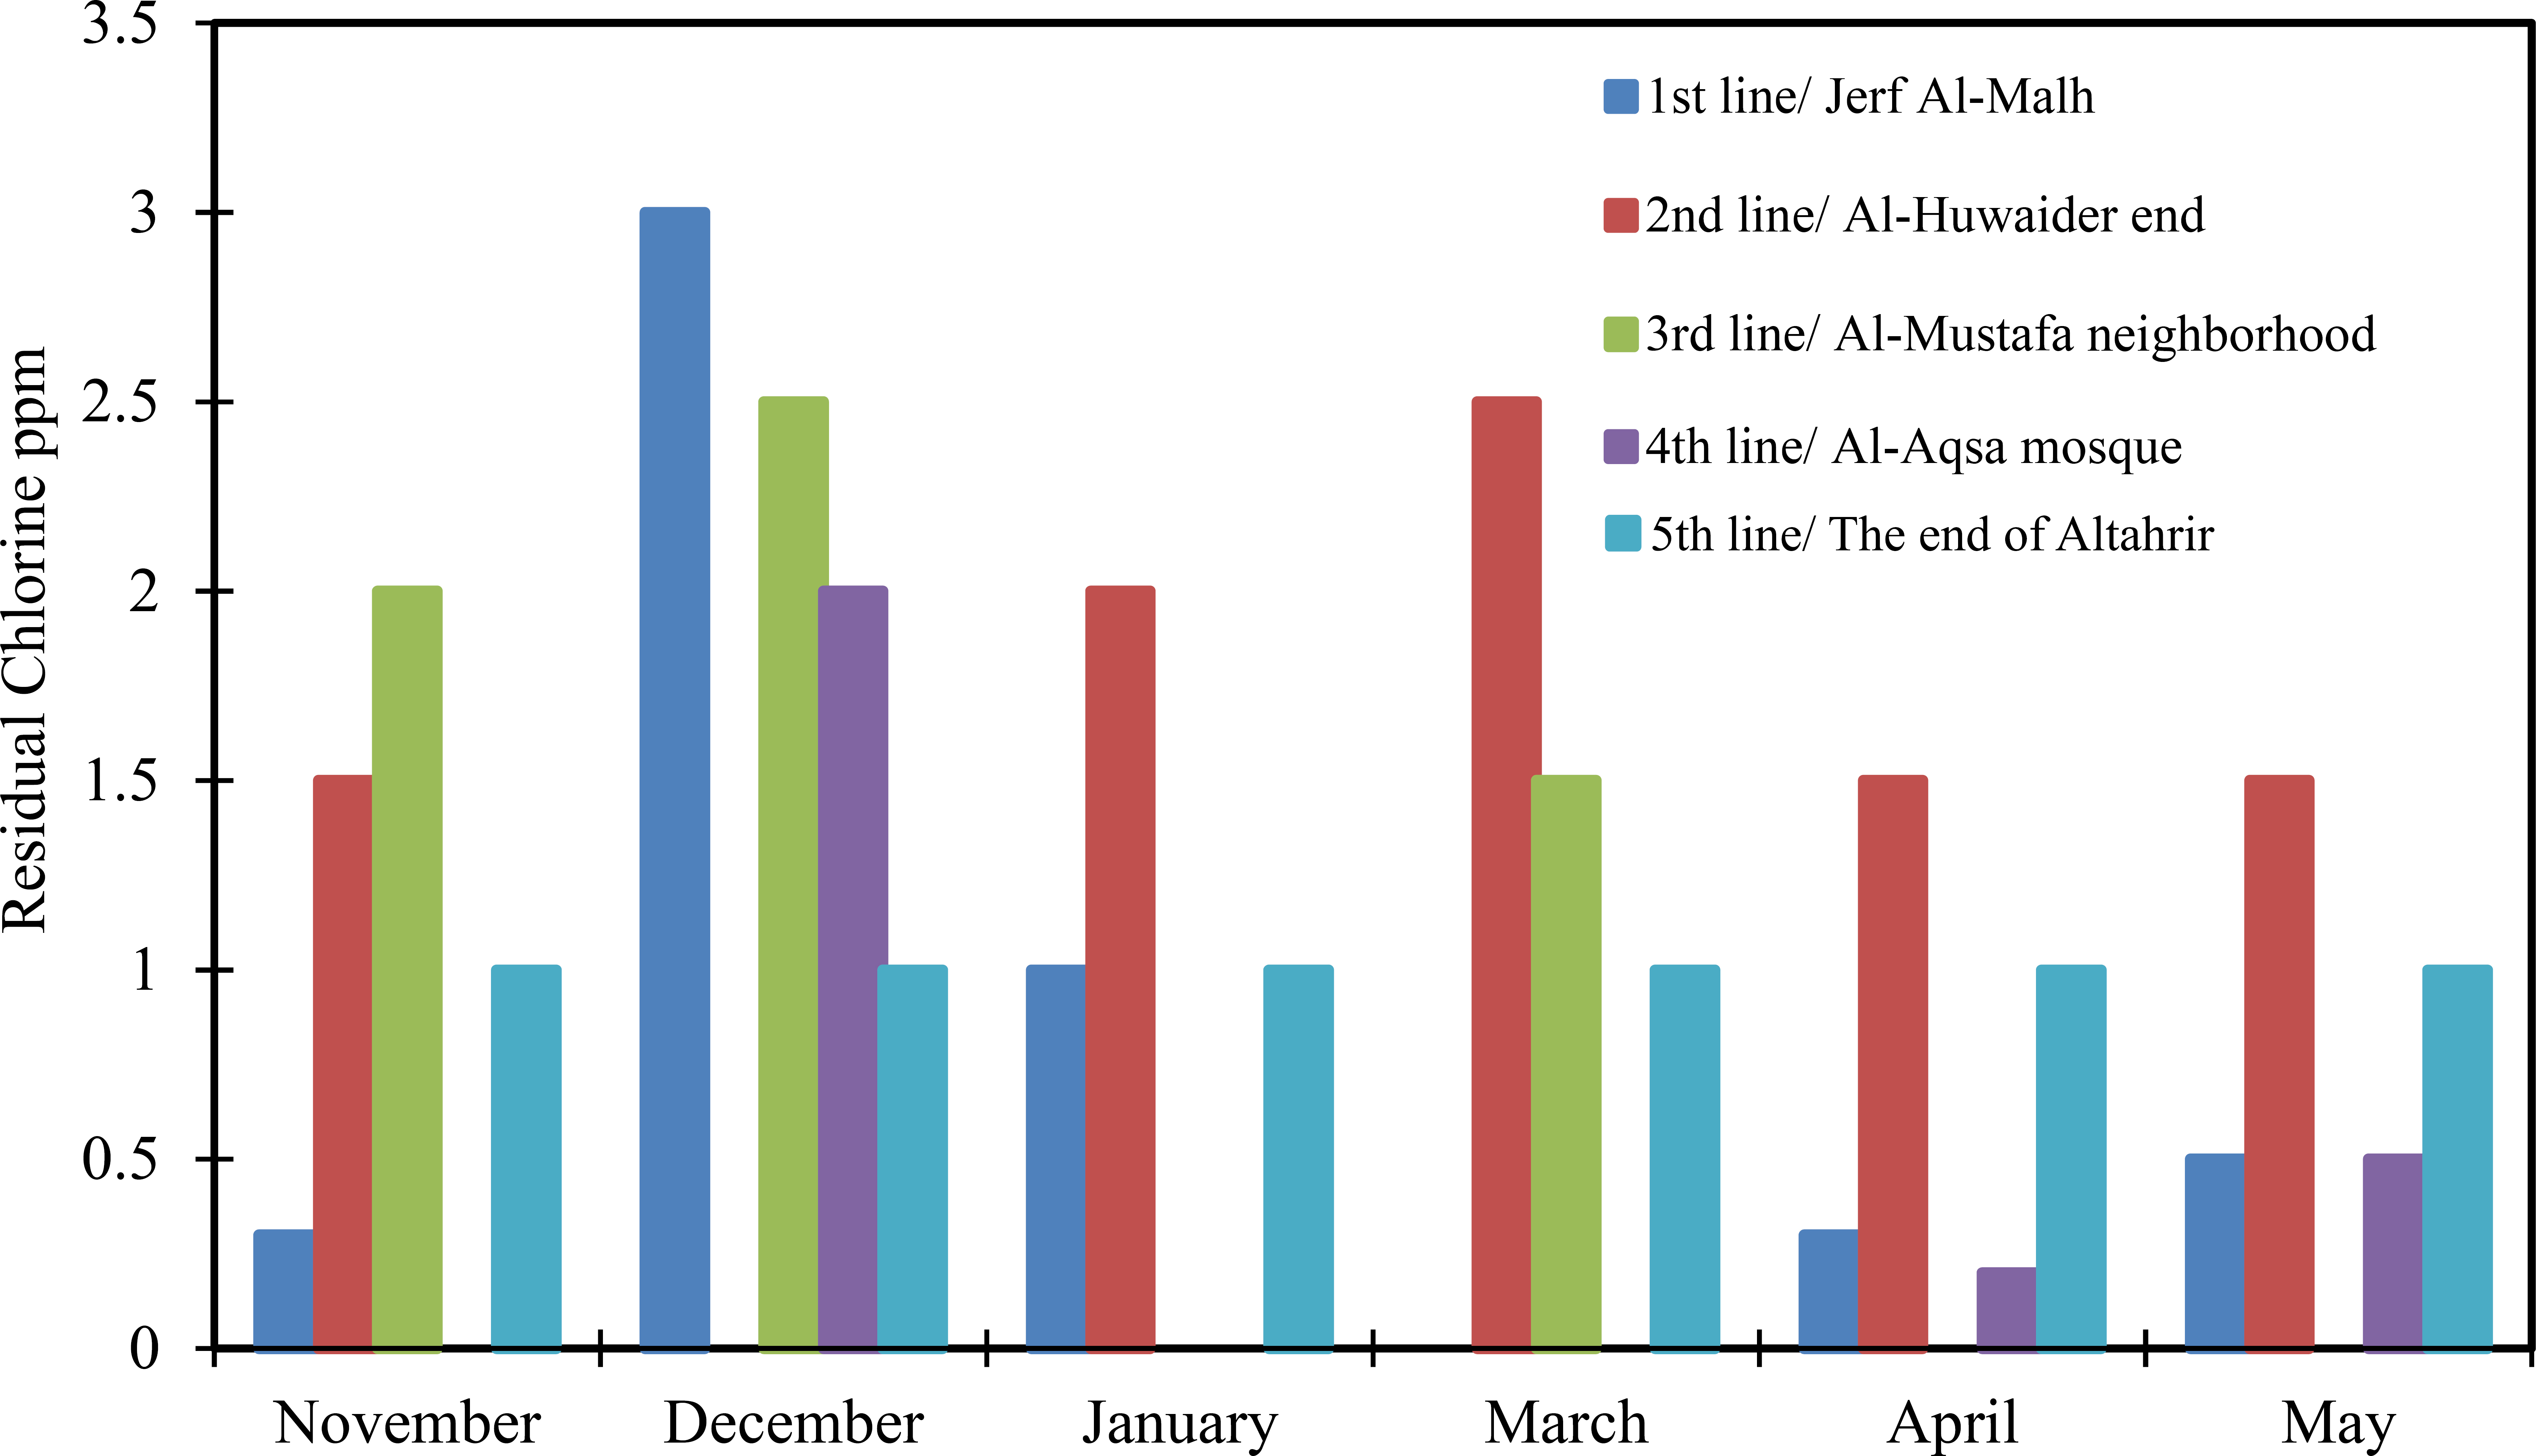
Residual chlorine in water samples collected from the five selected lines.
The detected reduction of residual chlorine concentrations from winter to summer across the selected water distribution lines can be ascribed to the combined effects of water temperature increases, pH variations, higher turbidity levels, and fluctuations in electrical conductivity, which cooperatively influence the efficiency of chlorine as a disinfectant in water systems. First of all, the water temperature considerably impacts chlorine stability and residual concentration. Higher water temperatures can accelerate chlorine decay. Accordingly, the residual chlorine levels tend to drop from winter (November to January) to summer (March to May) (Fig. 6). This behavior aligns with increased water temperatures during the warmer months (Fig. 2), which can cause faster chlorine dissipation and lower chlorine levels, as shown in Fig. (6). Second, pH levels impact the form of chlorine present in water. Higher pH levels favor the formation of hypochlorite ions, which are less effective as disinfectants. Indeed, the pH presents relatively stable values around neutral levels (7-7.5) throughout the months (Fig. 3). However, the minor increase in pH detected in warmer months can contribute to decreased residual chlorine concentrations (Fig. 6). Third, turbidity can also affect chlorine's efficiency by providing surfaces for bacteria to adhere to, which can shield them from disinfection. Referring to Fig. (4), the turbidity shows a considerable increase in January 2023, coinciding with lower residual chlorine levels (Fig. 6). Indeed, a greater value of turbidity can consume chlorine and mitigate its availability as a disinfectant. The subsequent months show lower turbidity (Fig. 4), which would correlate with higher residual chlorine concentrations during those periods. Fourth, the electrical conductivity is an indicator of the ion concentration in water, which can affect chlorine behavior and reactions. Referring to Fig. (5), the EC values present a general increasing trend from winter to summer months. Greater EC can indicate progressive ionic content, which can improve chlorine reaction rates and practically cause a faster depletion of residual chlorine. This behavior supports the observed reduction of chlorine levels during the warmer months (Fig. 6). Thus, the interplay of the studied influential factors can represent the difficulty of achieving efficient residual chlorine levels in water distribution systems. To adequately ensure perfect disinfection and water quality, continuous adjustment of these influential factors is vital, mainly as environmental conditions can change from winter to summer. Based on the obtained results for residual chlorine levels, there is a need to implement a proactive water management strategy to mitigate the effects of these influential factors on residual chlorine concentrations.
Figures (7-12) show the intensity of residual chlorine concentrations along the five selected water distribution lines from November 2022 to May 2023 using a GIS program. These figures provide visual representations of chlorine levels at different points along the pipeline network, which can highlight clear fluctuations in water quality. Figure (7) depicts the chlorine concentration across the network in November 2022. The maximum registered residual chlorine concentration is 3.29 ppm, signifying efficient chlorination in certain areas. The distinguished residual chlorine concentrations can be observed around Al-Rahma and Al-Huwaider regions, indicating effective chlorine retention in these areas. However, lower residual chlorine concentrations can be observed near the end of the distribution line at the endpoint of Al-Thahir.
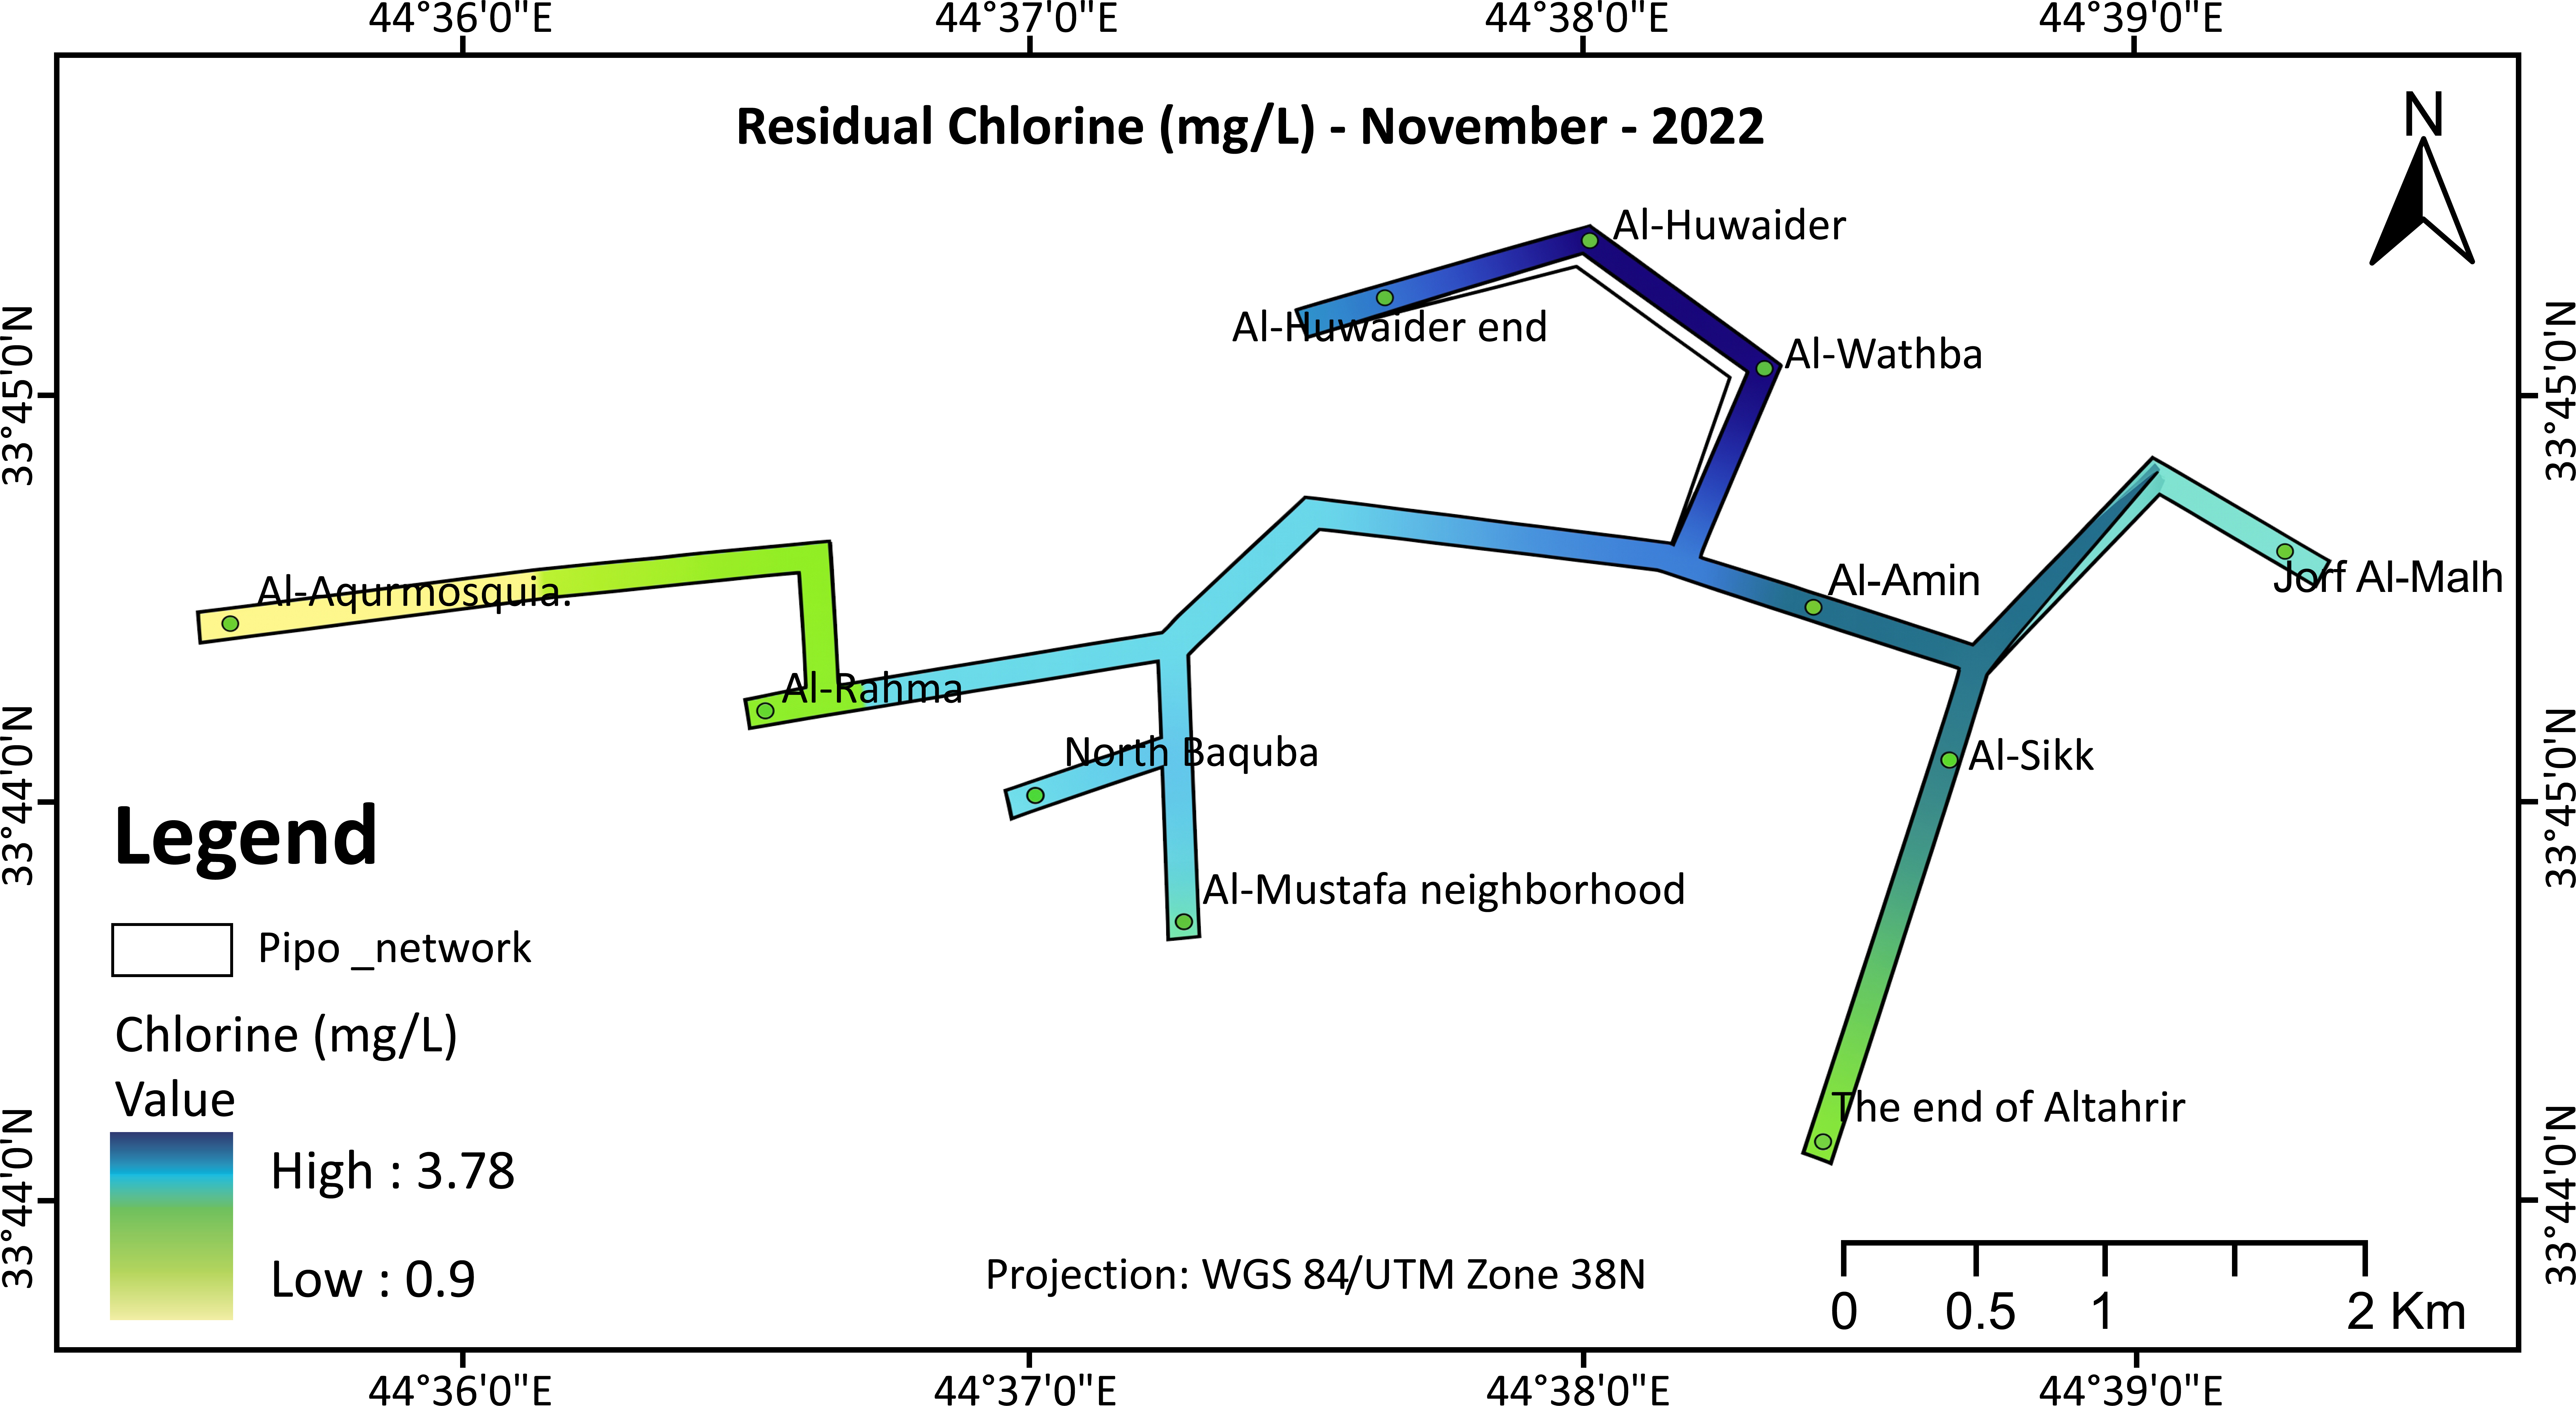
Intensity of residual chlorine concentration of five selected lines using GIS program during November 2022.
The field-measured data demonstrated in Table 3 can summarise monthly mean residual chlorine concentrations (ppm) for five selected distribution lines that served as the key input for the spatial analysis. Using ArcGIS Pro, these values were combined into a geospatial framework to develop spatial distribution maps, presenting the area chlorine decline patterns.
| Manth/Year | First Sampling Area | Second Sampling Area | Third Sampling Area |
|---|---|---|---|
| November/2022 | 3.8 | 2.6 | 0.9 |
| December/2022 | 4 | 2.8 | 1.7 |
| January/2023 | 3.1 | 1.2 | 0.8 |
| March/2023 | 3.8 | 2.4 | 1 |
| April/2023 | 3.8 | 2 | 0.6 |
| May/2023 | 3.7 | 2 | 0.7 |
Referring to the results shown in Fig. (8) for December 2022, the chlorine intensity shows slight variations compared to November 2022. The greatest residual chlorine concentration is 2.48 ppm, compared to 3.29 ppm in November 2022. More importantly, the distribution of residual chlorine remains comparatively uniform, with moderate levels observed in areas such as Al-Rahma, compared to other areas with reduced residual chlorine intensity, such as Al-Wathba. The lowest residual chlorine of 2.15 ppm is observed near the end of the lines, which may indicate potential issues with chlorine retention or water stagnation.
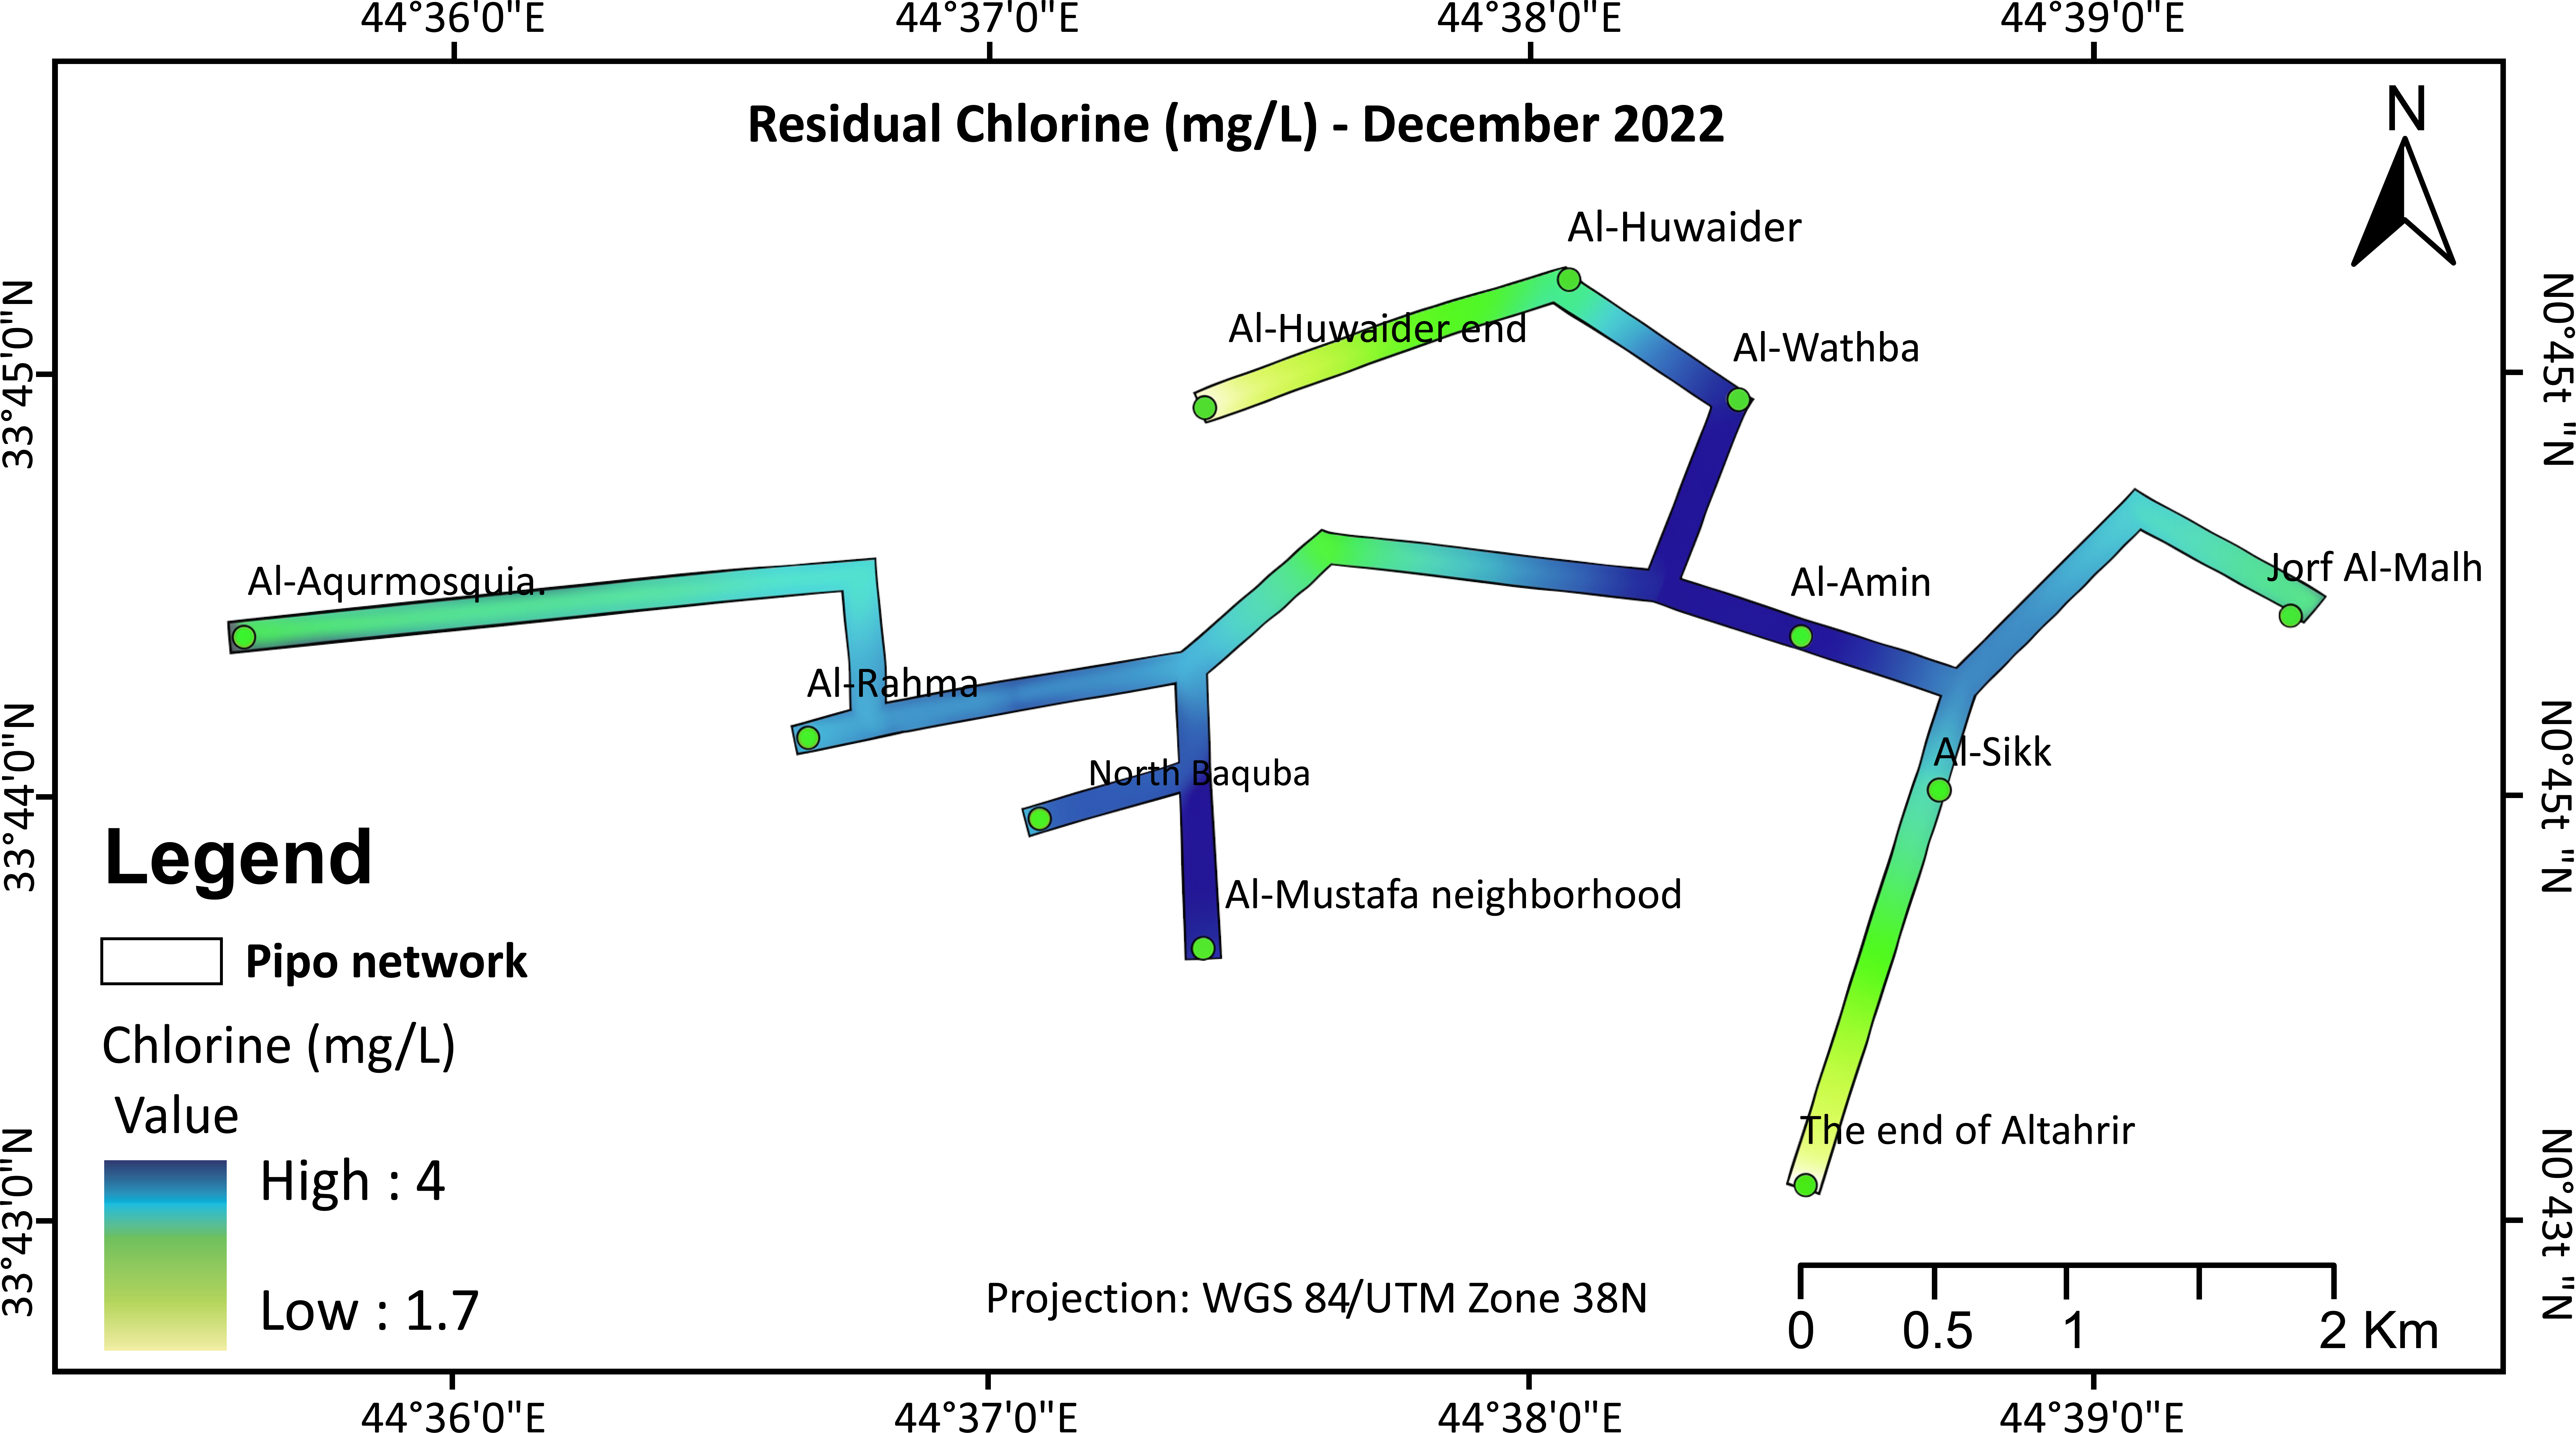
Intensity of residual chlorine concentration of five selected lines using GIS program during December 2022.
Considering the data presented in Fig. (9) for January 2023, a slight increase in residual chlorine of around 3.1 ppm is observed. In this regard, Al-Huwaider demonstrates an improved residual chlorine level compared to the end of distribution lines, which still have reduced residual chlorine levels of 0.0028 ppm. Accordingly, this would ascertain the fact of a number of remaining challenges that affect the consistency of distribution.
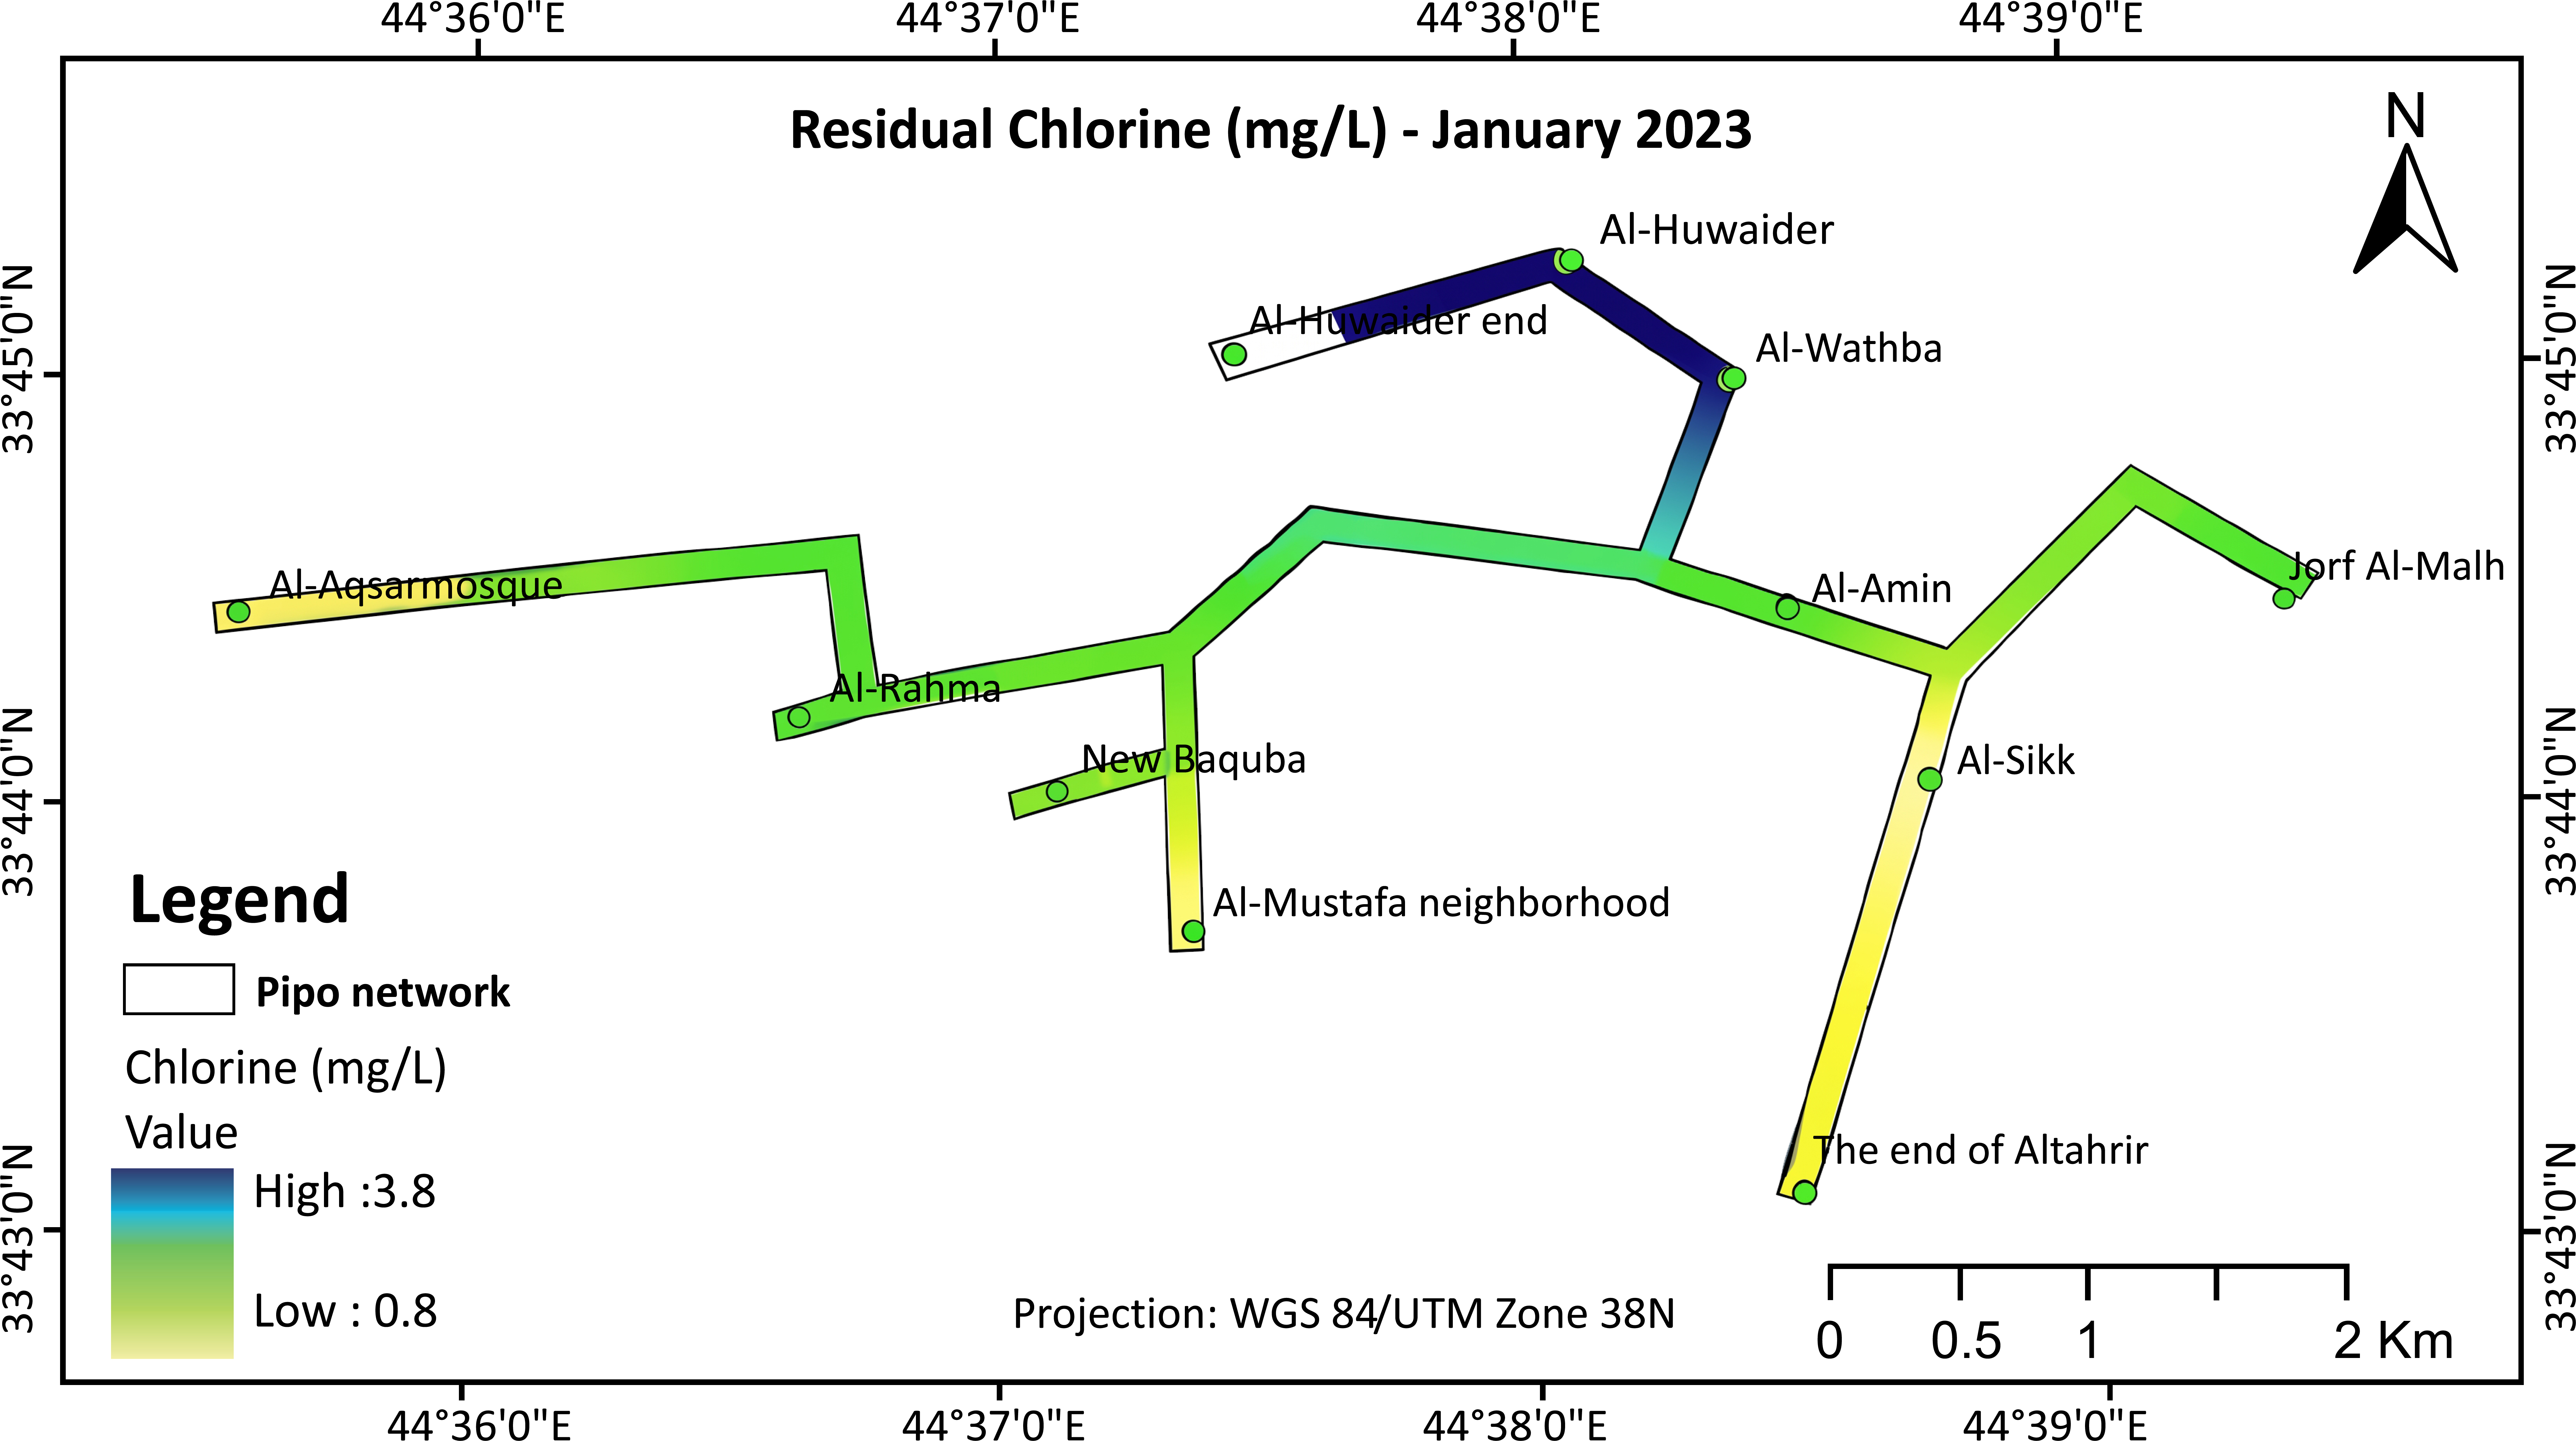
Intensity of residual chlorine concentration of five selected lines using GIS program during January 2023.
Fig. (10) of March 2023 signifies a peak in residual chlorine concentration, where the maximum recorded concentration is 3.99 ppm (efficient chlorination) in Al-Huwaider compared to the ends of the network that exhibit diminished residual chlorine levels, with values as low as 0.0020 ppm.
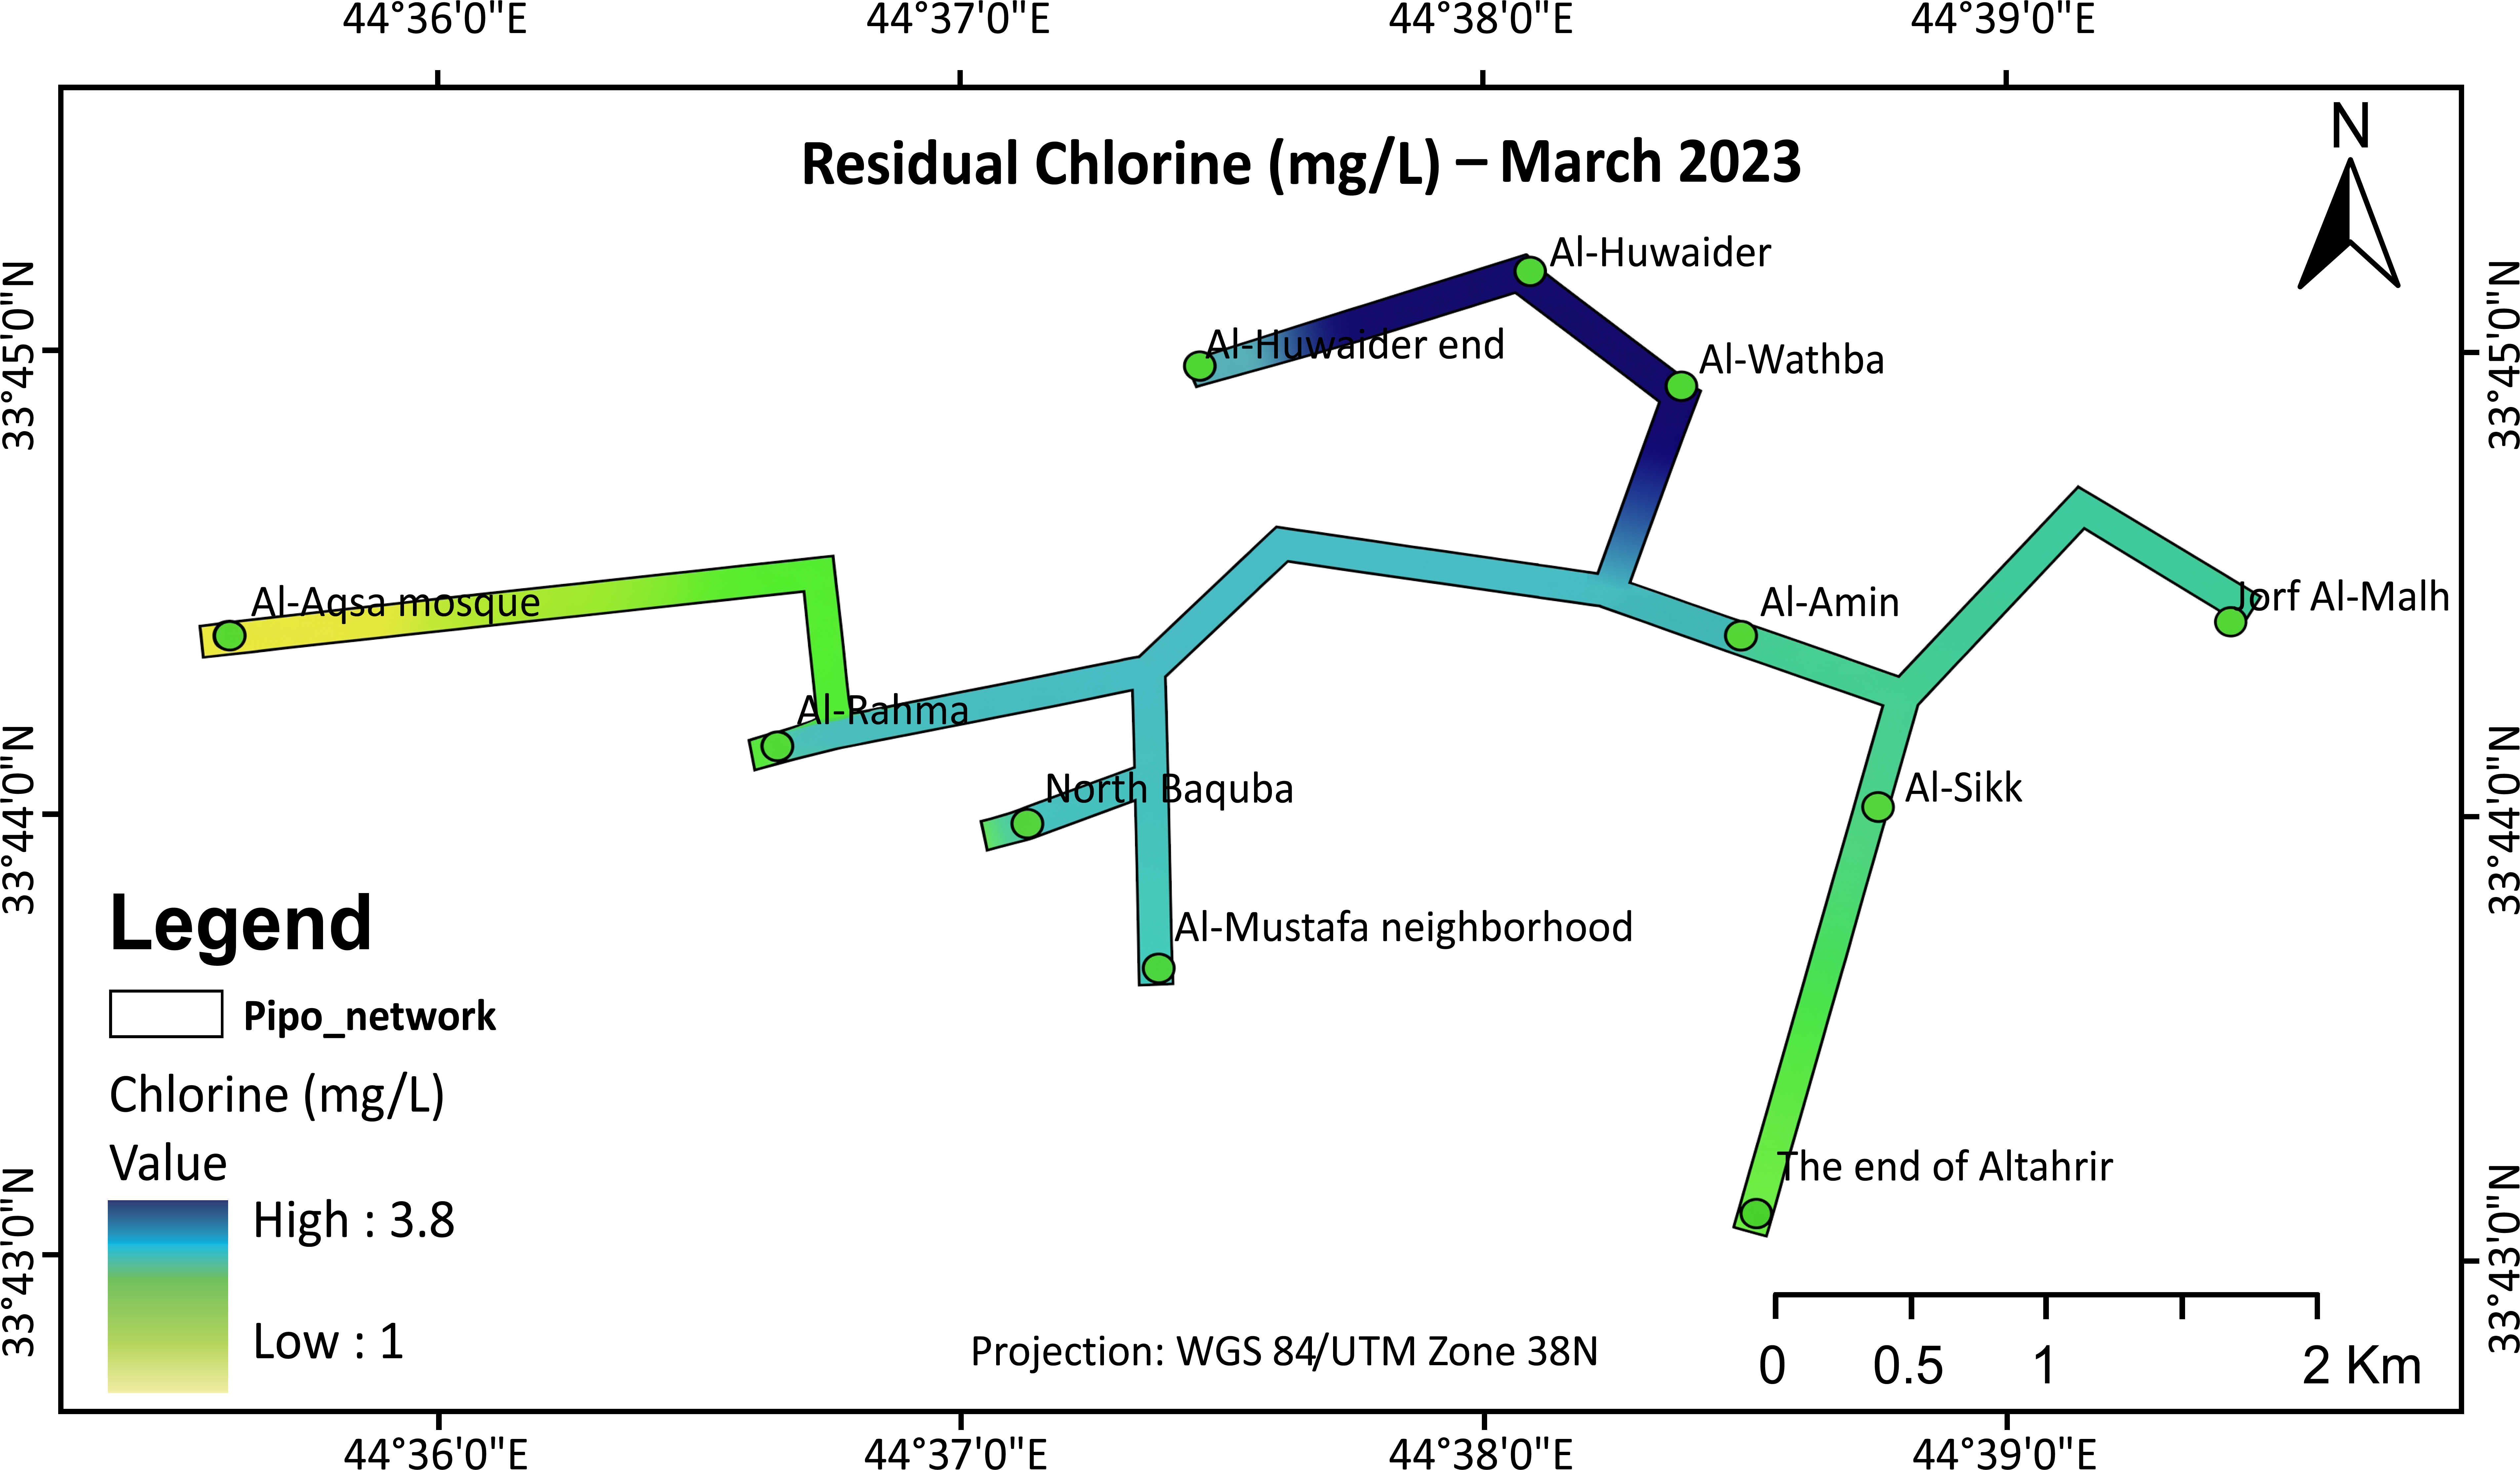
Intensity of residual chlorine concentration of five selected lines using GIS program during March 2023.
In April 2023, Fig. (11) shows a considerable decrease in residual chlorine. In this aspect, the maximum recorded concentration drops to 1.67 ppm, signifying potential challenges in preserving chlorine levels. Specifically, Fig. (11) depicts that some areas have moderateresidual chlorine levels and others are approaching critical levels. This reduction of residual chlorine can indicate a potential issue in water treatment or distribution effectiveness.
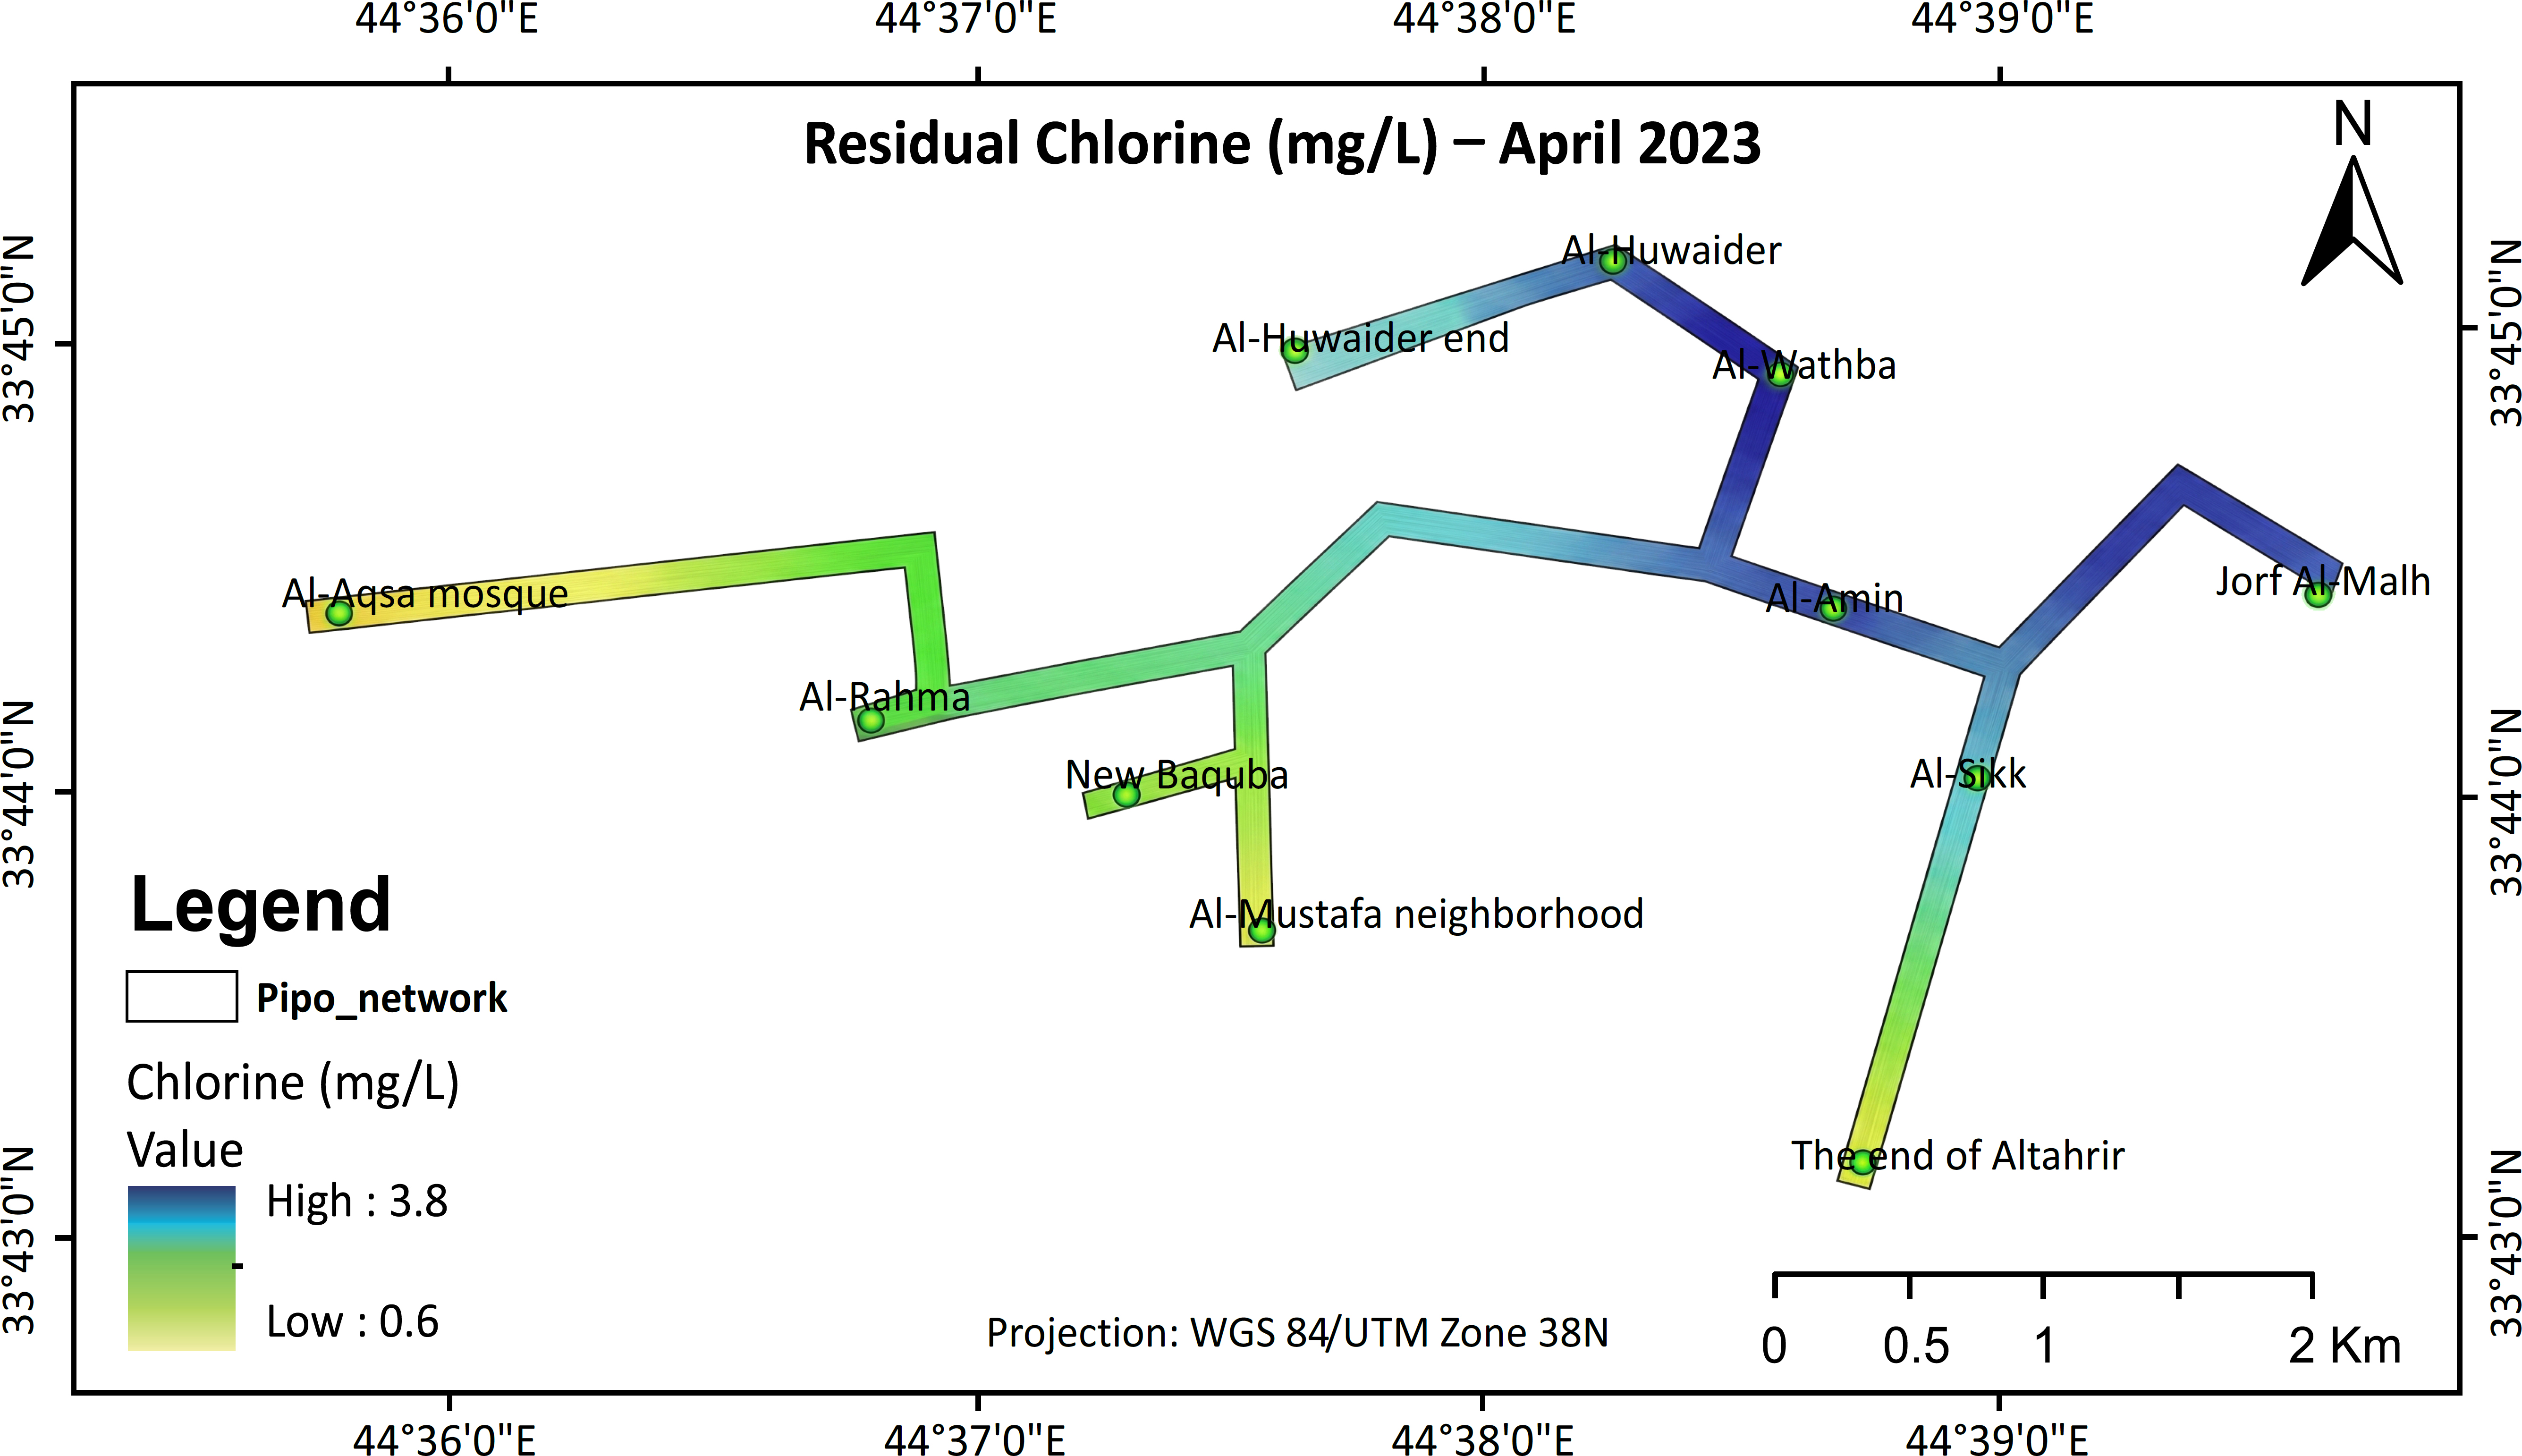
Intensity of residual chlorine concentration of five selected lines using GIS program during April 2023.
Finally, Fig. (12) for May 2023 shows a continued trend of reduced residual chlorine concentrations, with a maximum of 2.67 ppm, an improvement from April 2023 but still lower than earlier months. More importantly, the ends of lines exhibit the lowest values (1.01 ppm), signifying persistent challenges in chlorine delivery to these areas.
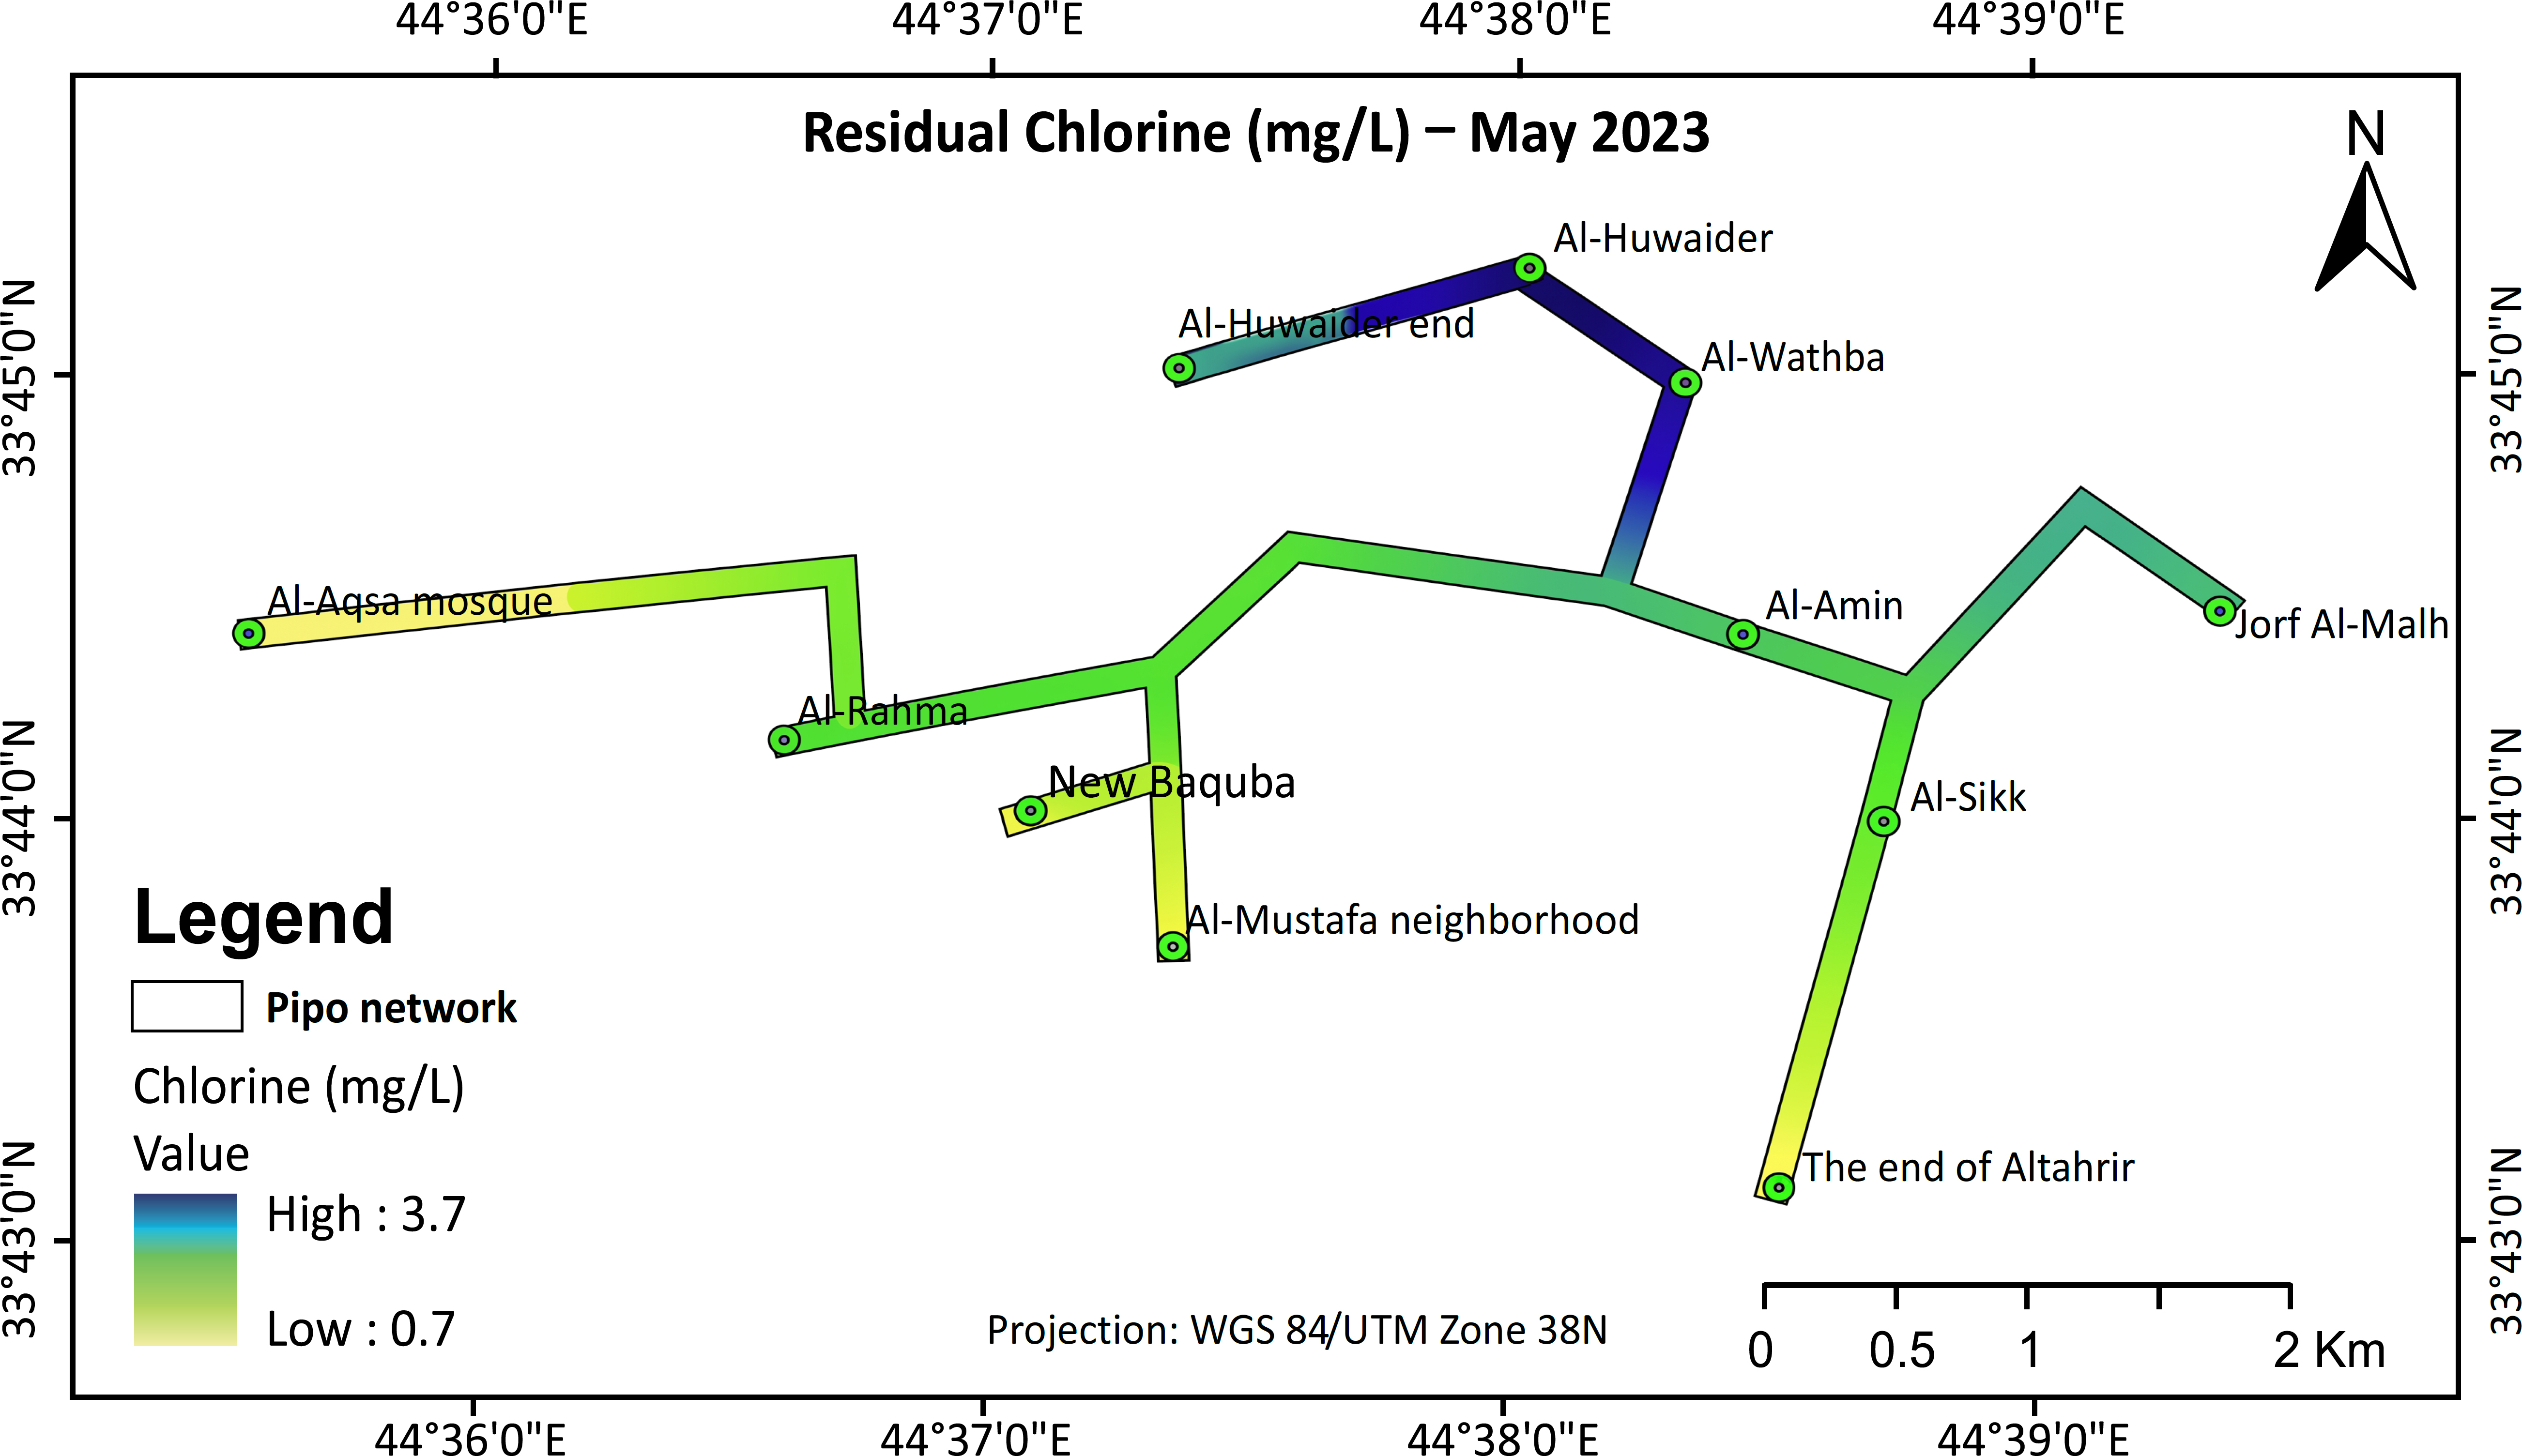
Intensity of residual chlorine concentration of five selected lines using GIS program during May 2023.
Figure (13) shows the relationship between the distance traveled by water and the residual chlorine for five selected lines during the testing period from November 2022 to May 2023. It can be stated that the higher the distance traveled (from 1500 m to 3000 m), the lower the concentration. In other words, the percentage of free chlorine decreases with distance from the water source (the place of chlorine treatment). The reduction of free chlorine at 2000 m can be attributed to the possibility of its evaporation due to the long distance. To systematically resolve this issue and ensure that sufficient quantities of water reach distant points with high residual chlorine levels, the water quality supervisors constructed booster stations at a distance of 1500 m from the five lines to strengthen water pumping to distant areas, in addition to increasing the free-chlorine dose. This can be attributed to the increase in free chlorine concentrations in water samples at 3000 m, as can be seen in Fig. (13). Referring to the above discussion, it is essential to clarify that the high residual chlorine values (ranging between 3 and 5 ppm) observed at certain sampling points represent locations in the immediate vicinity of the main pumping station. These increased initial chlorine concentrations are intentionally preserved by the plant operators to compensate for the significant decay during distribution and guarantee that an adequate residual level (0.2-0.5 ppm) reaches the ends of the network. In other words, the observed field values reflect the natural gradient from the source to the terminals.
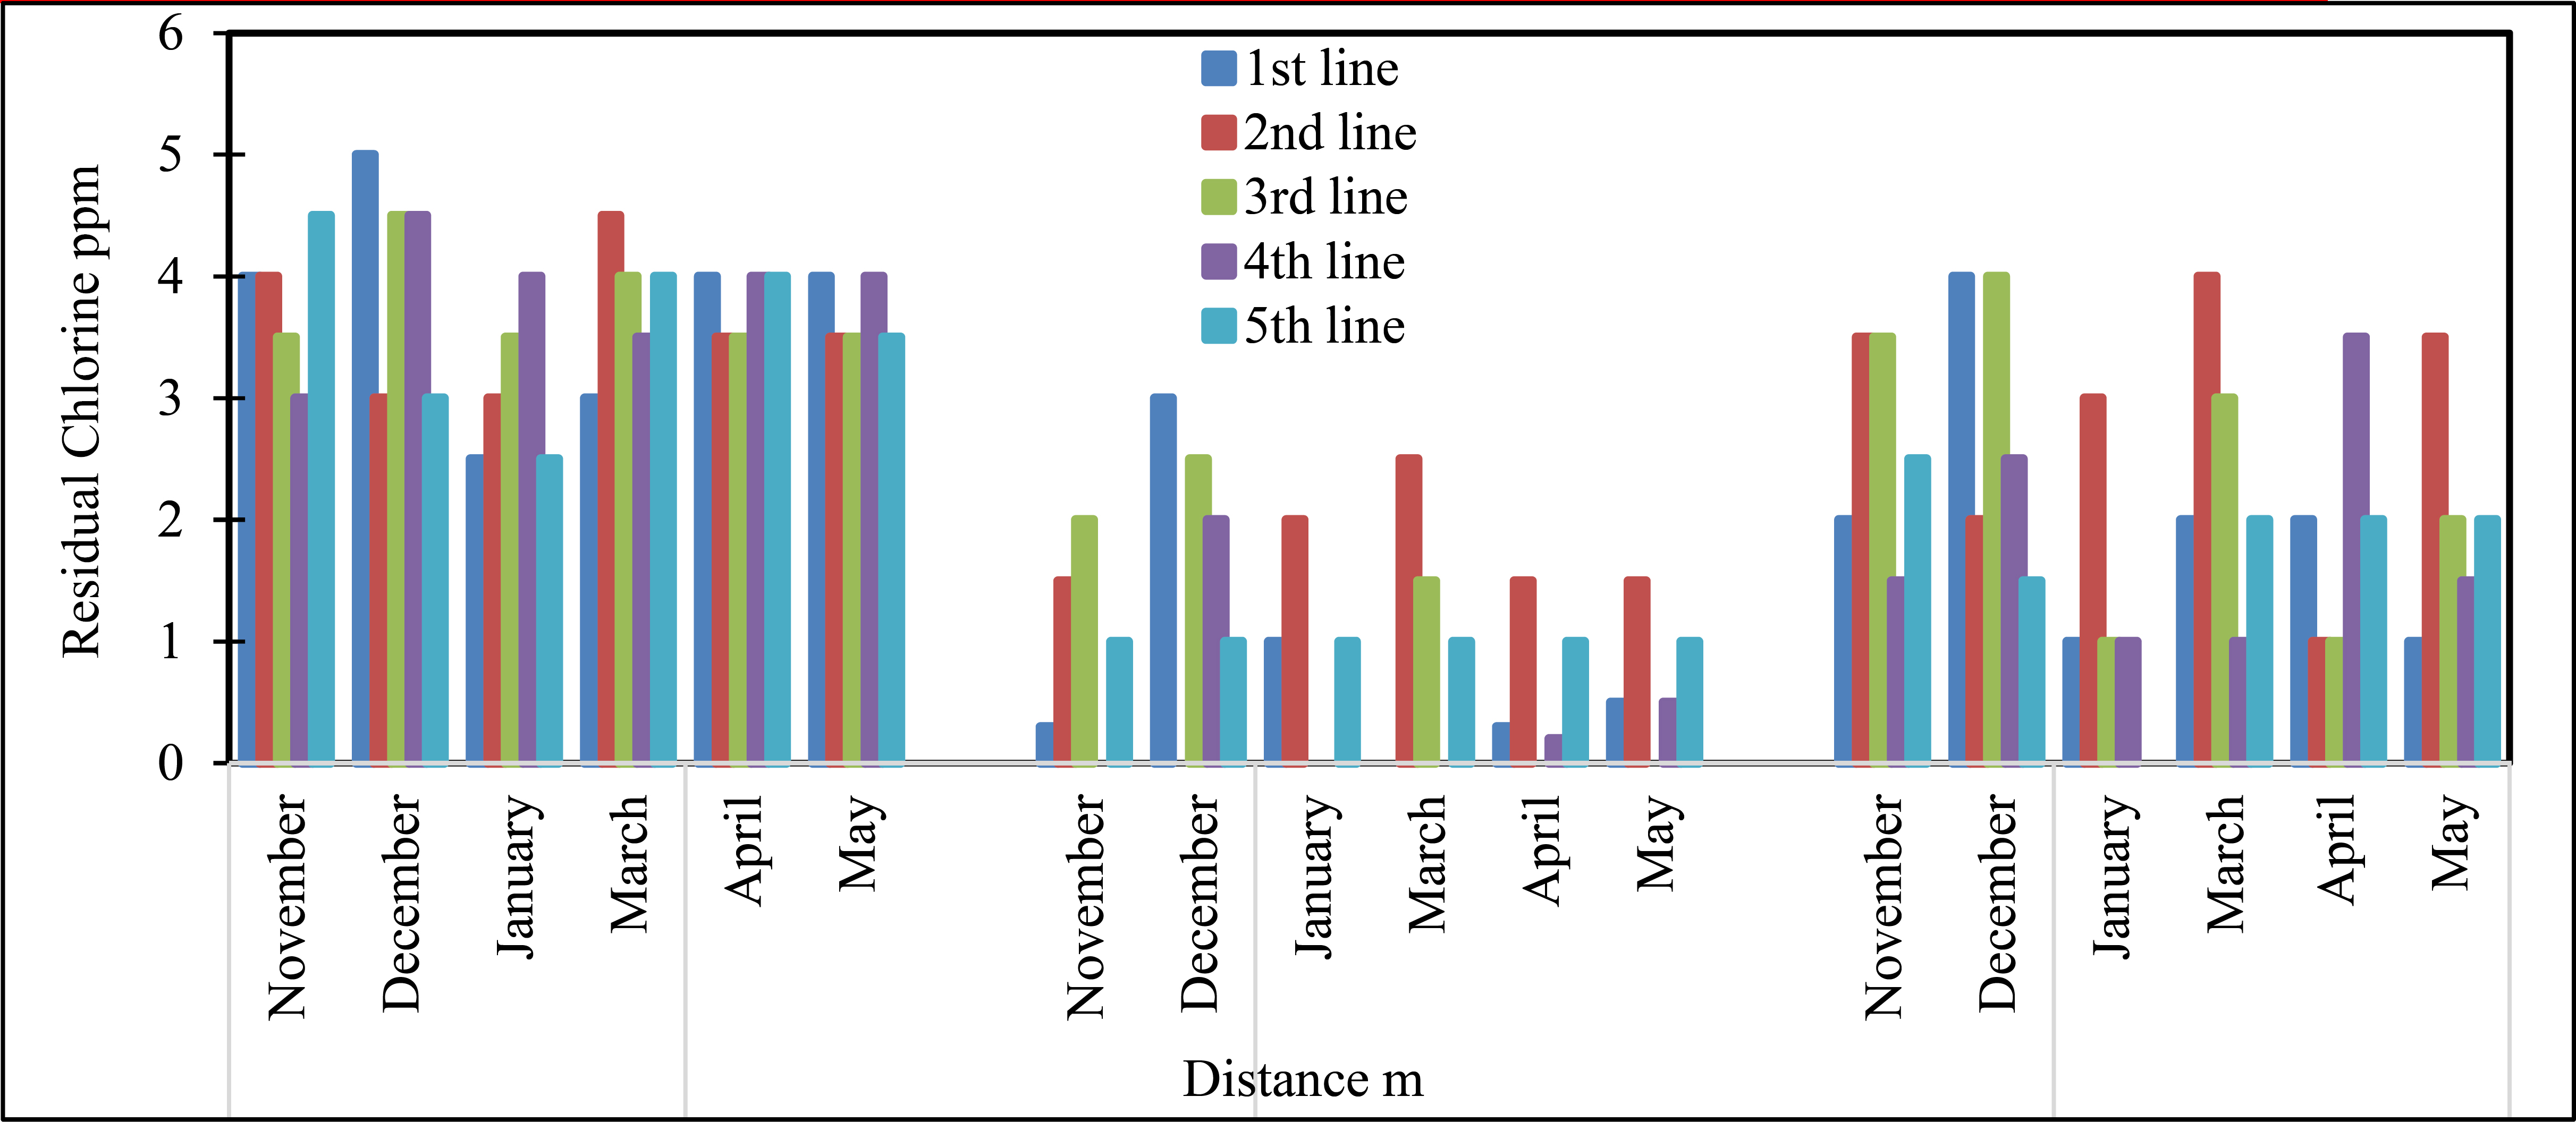
Effect of distance on the residual chlorine of water samples collected from the five selected lines.
3.6. Bacteriological Tests
When the Plate count exceeds the permissible limit (100 according to the Iraqi Standard Specification for Drinking Water), it suggests bacterial contamination in the water. This can be an indicator of various possible issues, including contamination of the water network. Referring to the data in Fig. (14), it is evident that bacterial contamination (Plate count) exceeds the permissible limits of the Iraqi Standard Specification for Drinking Water. In this regard, contamination was recorded in several lines within the study area, especially in the fourth line, which spans the area between the water project and Al-Aqsa Mosque in Al-Rahma district. This area is characterized by inadequate services and frequent tampering by residents with the water network, leading to occasional pipe breaks and, consequently, contamination of drinking water with sewage and other pollutants. More importantly, the presence of bacterial contamination across multiple areas can indicate insufficient residual chlorine to kill bacteria. Water leakage from external sources, such as sewage or other environmental contamination, can also lead to contamination of the water network. It is crucial to address and resolve these issues to ensure safe, clean drinking water is provided to the affected areas. Proper maintenance and repair of the water network, as well as raising awareness among residents about the importance of preserving water quality, can help mitigate bacterial contamination and ensure the safety of the drinking water supply.
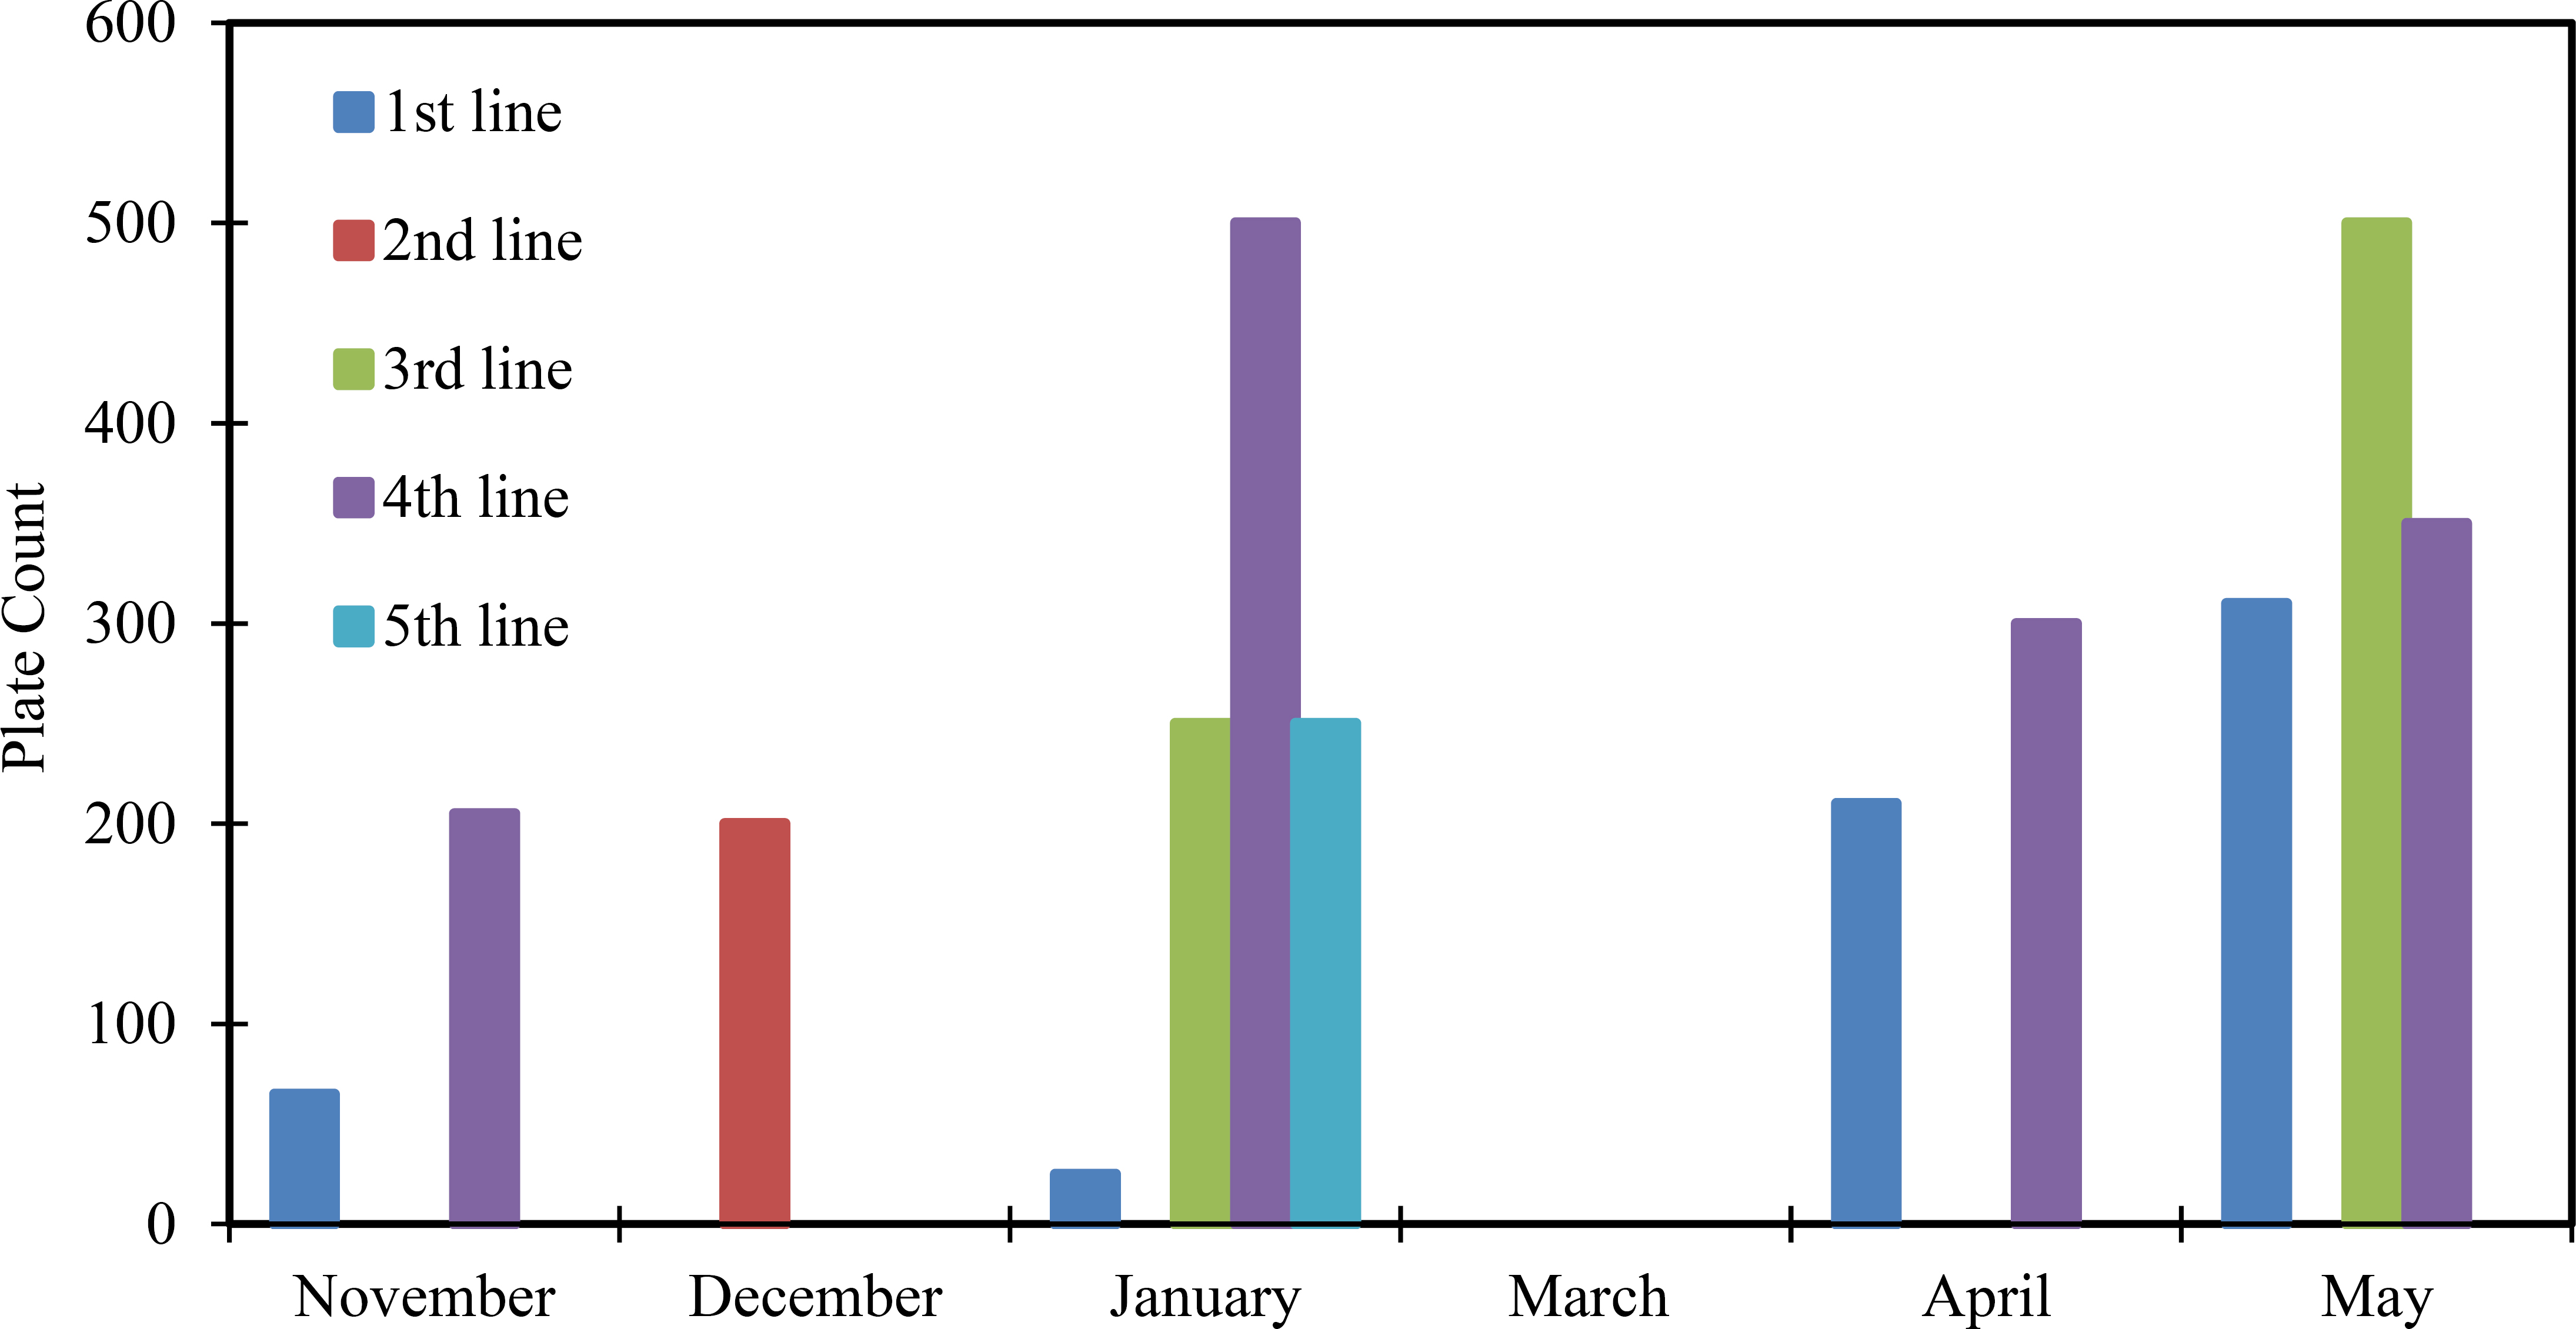
Plate count of water samples collected from the five lines.
Clearly, while total coliforms and high plate counts were detected in low-chlorine areas, E. coli was absent. This suggests that the presence of the bacteria can be ascribed to environmental intrusion or biofilm regrowth in the old pipe network rather than direct recent contamination. From a public health perspective, this indicates a decline in water quality during distribution, requiring a more vigorous secondary disinfection strategy.
Figuers (15 and 16) show the MPN Coli/100 mL and total MPN/100 mL for the five lines in water samples. Although Fig. (15) indicates the absence of E. coli, a total MPN/100 mL was detected in Fig. (16), which should not be detectable in any 100 mL water sample.
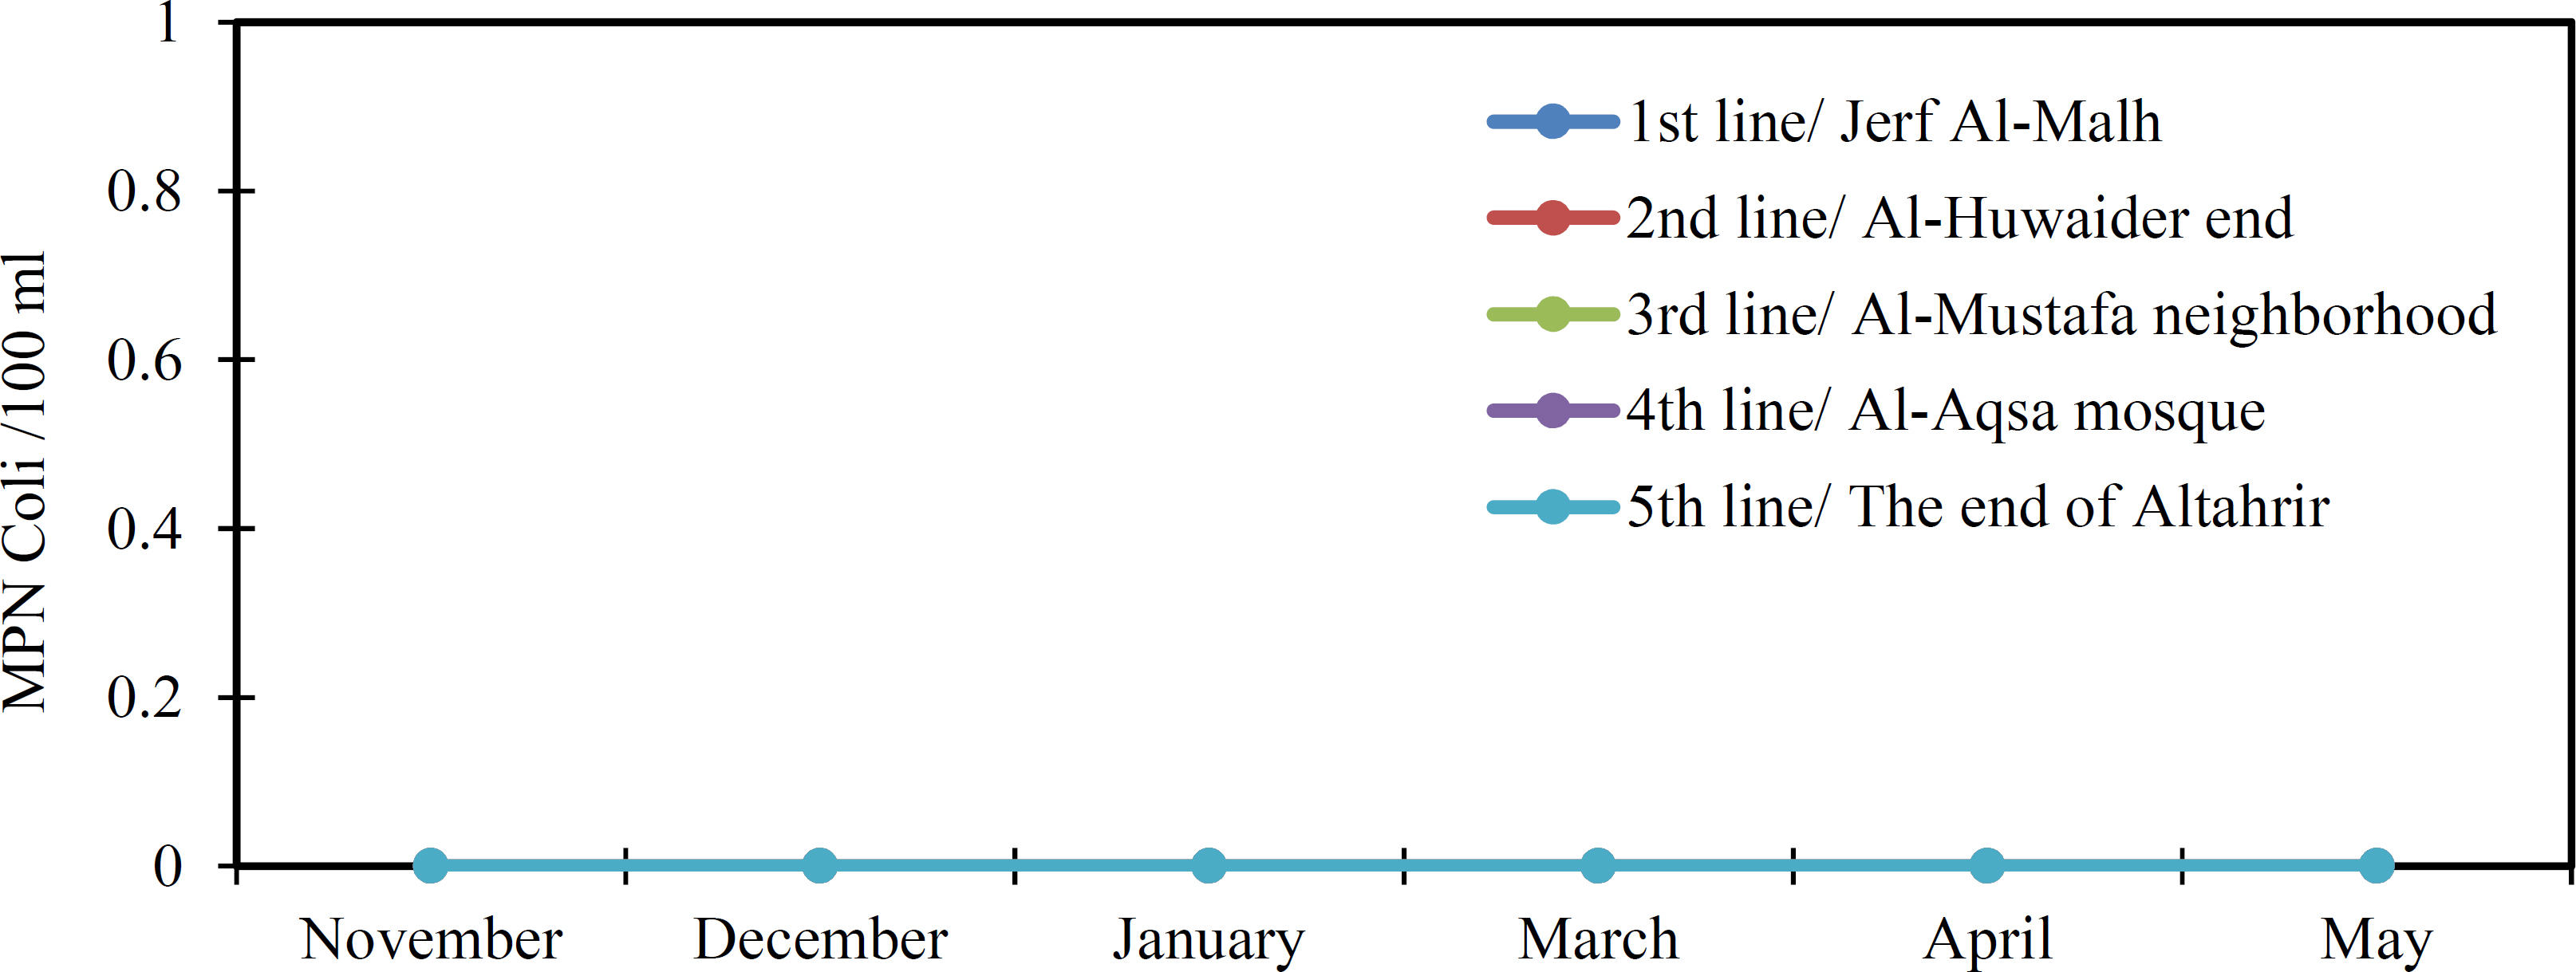
MPN coli/100 mL of water samples collected from the five selected lines.
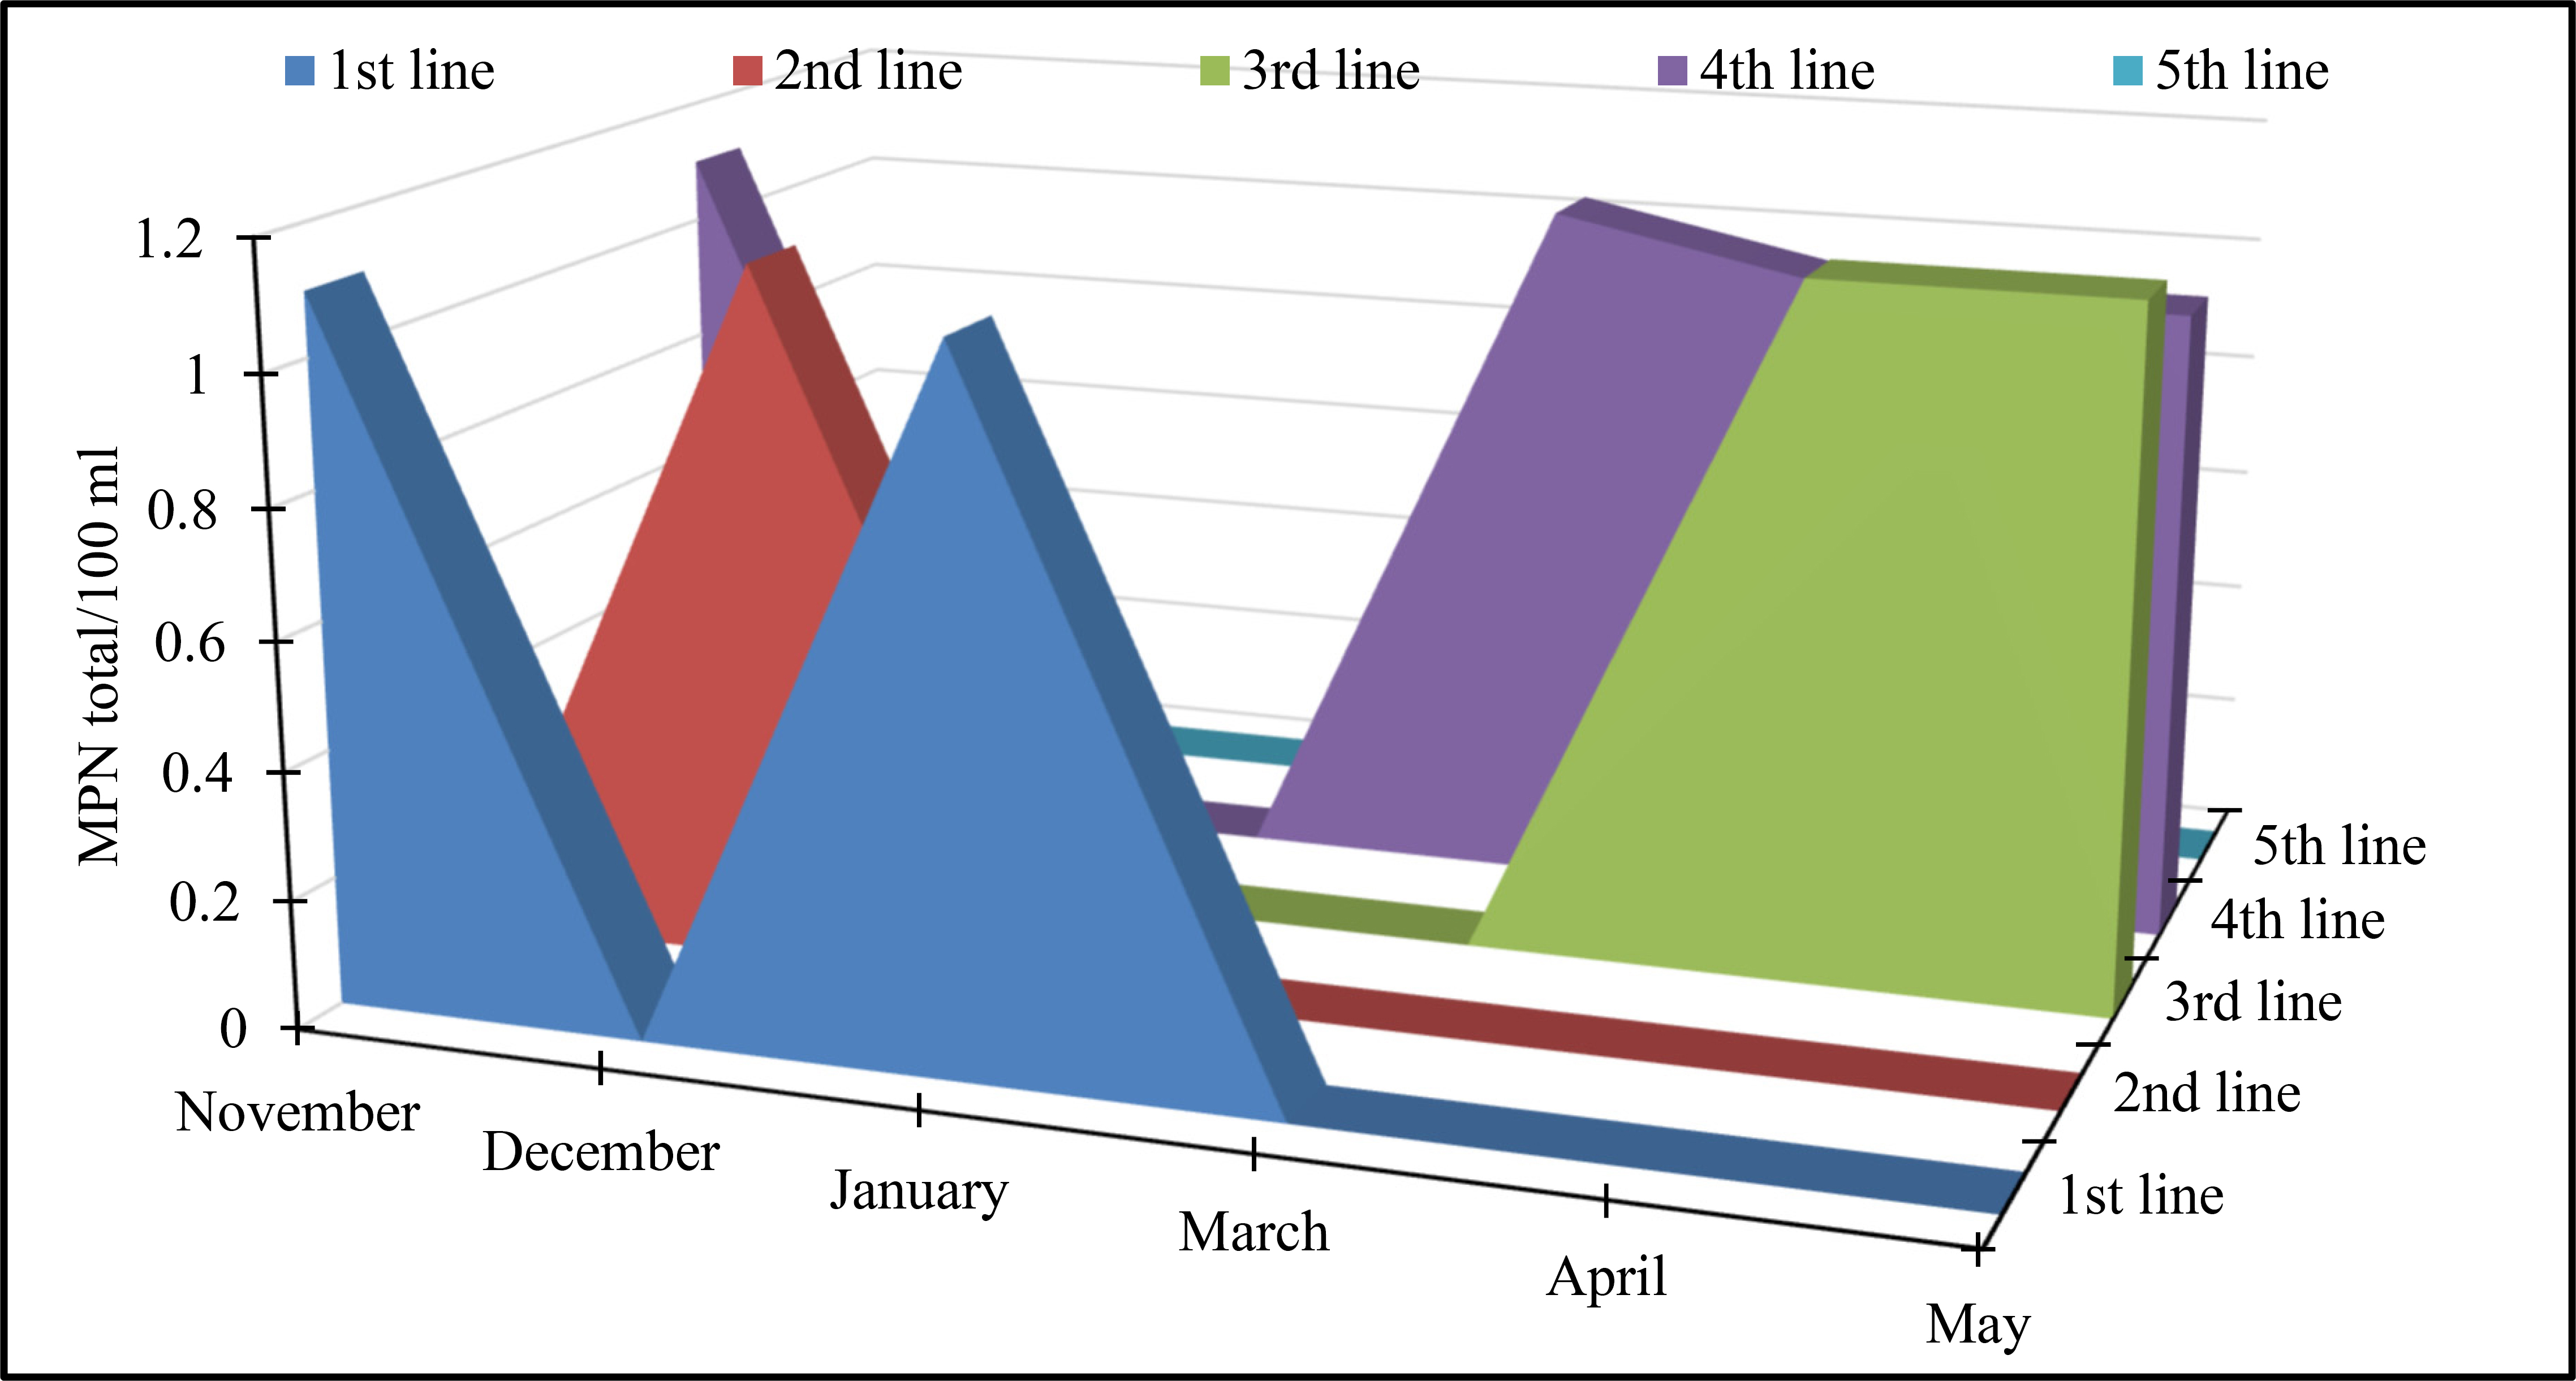
MPN total /100 ml of water samples collected from the five selected lines.
3.7. Statistical Correlation Analysis
Preliminary statistical evaluation using Pearson correlation analysis (Table 4) ascertains a vigorous relationship between the examined environmental factors and residual chlorine concentrations. A considerable negative correlation was indicated between chlorine concentration and transmission distance (r = -0.842, p < 0.001). This indicates that the disinfectant is continuously consumed as the water moves through the Baquba central water treatment plant. Moderately negative correlations were also detected for water temperature (r = -0.450, p = 0.012) and turbidity (r = -0.421, p = 0.021). These results indicate that thermal kinetics and suspended particles also meaningfully contribute to chlorine degradation, while distance is the most important factor. However, pH and electrical conductivity showed no statistically significant effects, suggesting that they are secondary factors within the observed limits of this research.
| Independent Variable | n | Pearson Correlation(r) | P-Value (Sig.) | Interpretation |
|---|---|---|---|---|
| Transmission Distance (m) | 30 | -0.842 | < 0.001* | Interpretation |
| Water Temperature (°C) | 30 | -0.450 | 0.012* | Strong Negative Correlation |
| Turbidity (NTU) | 30 | -0.421 | 0.021* | Moderate Negative Correlation |
| Electrical Conductivity (E.C.) | 30 | -0.290 | 0.121 | Moderate Negative Correlation |
| pH Level | 30 | +0.120 | 0.528 | Non-Significant |
To further quantify the relative contribution of each significant factor, a multiple linear regression (MLR) model was developed, as shown in Table 5. The model showed high predictive power (R2 of 0.78, p<0.001), explaining 78% of the variation in residual chlorine reduction. Quantitative identification confirms that the 'water age' associated with long-distance transfer is the key driver of chlorine loss in the water network. It mathematically indicates the regression constant (4.852) for the initial dose, compared with the negative coefficients for distance, temperature, and turbidity. Indeed, this would indicate the rate of chlorine decay as the water moves towards the edge of the network.
| Predictor Variable | Unstandardized B | Standardized Beta (β) | t-Value | P-Value |
|---|---|---|---|---|
| (Constant) | 4.852 | — | 8.241 | < 0.001 |
| Distance | -0.0008 | -0.65 | -5.120 | < 0.001* |
| Temperature | -0.035 | -0.22 | -2.451 | 0.015* |
| Turbidity | -0.012 | -0.18 | -2.102 | 0.038* |
Referring to the above statistical correlation analysis, the detected spatial and temporal variations in residual chlorine concentrations in the water distribution network in Baquba are not just isolated trends, but are deeply rooted in the following local hydrology and operating environment:
(1) The source water of the Diyala River depicts notable variations in turbidity, particularly throughout the rainy season. The high-turbidity level delivers a protective shield for microorganisms and consumes chlorine through adsorption on suspended substances. Even though this necessitates a higher initial dose, these particles hasten the chlorine reduction as the water moves through the network.
(2) The robust negative correlation between water chlorine levels and water temperature signifies the climatic features of the studied area. Elevated temperatures catalyze the chemical oxidation of organic materials and increase disinfectant evaporation, which would explain near-zero residues at network loops (e.g., Jerf al-Malh and al-Tahrir) throughout hot periods.
(3) The majority of the Baquba pipeline network consists of old ductile and cast-iron pipes. These pipes can form internal corrosion scales and biofilms over time, continuously increasing the chlorine demand. Indeed, the contact time between water and the pipe walls increases as the transmission distance increases, which can degrade the contact before it reaches end users.
(4) The specific increases in chlorine concentration at specific points (for example, near the 3000 m mark) would indicate interference by intermediate booster stations. These measures are important to counteract cumulative reduction and certify that even remote areas preserve minimum levels of residual chlorine.
CONCLUSIONS
The current research aimed to assess the quality of drinking water in Baquba city center by determining residual chlorine concentration and key physical parameters, including pH, water temperature, turbidity, and electrical conductivity. It sought to contrast these factors with Iraqi Standards to specify water safety for human consumption and to assess the efficiency of chlorine in eliminating bacteria. The sampling design, using three points along each of five distribution lines over 7 months, established a robust and practical framework for analysing chlorine decay in the Water Distribution Network in Baquba city. This methodology captured spatial gradients from source to endpoint along directional lines, aligning with standard water quality monitoring protocols that prioritize distance-based sampling to detect decay patterns influenced by flow dynamics, pipe age, and infrastructure variability. The research also employed GIS tools to map areas of bacterial contamination associated with inadequate residual chlorine levels. Interestingly, GIS mapping validated the inclusive spatial coverage of the central project's key supply directions.
The following findings can be presented:
(1) It became clear that the most polluted lines (the worst deterioration in water quality) are lines 3, 4, and 5 in Baquba City, due to zero residual chlorine, which caused bacterial contamination (Plate count) exceeding the permissible limits. This result has demonstrated satisfactory statistical power and practical relevance for Baquba's 75M gallon/day network serving 450,000 people.
(2) The greater the distance traveled by drinking water containing chlorine, the less the residual chlorine.
(3) Water temperature was identified as a notable factor linked to fluctuations in residual chlorine concentration.
(4) The results identified that the minor increase in pH during the summer period can act as a contributing parameter to the instability of chlorine concentration, as a higher pH level is particularly associated with less potent disinfectant species.
(5) Turbidity is inversely proportional to sterilization efficiency; as turbidity increases, residual chlorine concentration decreases. Specifically, increased turbidity observed in January 2023 can potentially contribute to increased chlorine demand, further reducing its availability for disinfection.
(6) Higher EC levels can indicate a greater ion presence, which can accelerate chlorine reactions, leading to quicker depletion.
(7) Although there are some periods of efficient chlorine management, maintaining consistent residual chlorine concentrations remains a challenge, particularly towards the extremities of the distribution lines, where several parameters can affect its persistence.
(8) The existence of aged and dilapidated pipes within the Baquba water distribution network can significantly increase the risk of breakage and subsequent water contamination. These would contribute to declining residual chlorine concentration to levels that might be inadequate to control the growth of coliform bacteria.
The obtained results can provide clear insights into successfully improving water quality across the distribution lines of Baquba city. Despite the practicality of this research, a number of limitations can be stated. First, sampling at three points along each line over 7 months might not perfectly imitate short-term operational variations such as flow fluctuations and dosing. Second, organic load and chlorine speciation are other chlorine demand drivers that can cause chlorine loss, but their effects were not explained. Third, to effectively interpret the low residual chlorine linked to bacterial incidence, a strict policy of frequent and expanded sampling, a longer monitoring period, and support from detailed pipe and flow data are required.
AUTHORS’ CONTRIBUTIONS
The authors confirm their contributions to the paper as follows: Conceptualization, K.H.R.; Methodology, A.H.K., and Q.A.N.; Formal analysis, K.H.R., A.H.K., and Q.A.N.; investigation, K.H.R., A.H.K.; Resources, A.H.K.; Writing—original draft preparation, K.H.R., and M.A.AL-O; Writing—review and editing, M.A.AL-O.; Visualization, M.A.AL-O; Supervision, M.A.AL-O.; Project administration, M.A.AL-O. All authors have read and agreed to the published version of the manuscript.
LIST OF ABBREVIATIONS
| APHA | = American Public Health Association |
| BGLB | = Brilliant Green Lactose Bile |
| DMA | = District Metered Area |
| EC | = Electrical Conductivity |
| EMB | = Eosin-Methylene Blue |
| FC | = Fecal Coliforms |
| GIS | = Geographical Information System |
| IDW | = Inverse Distance Weighting |
| LOQ | = Quantitation Limit |
| MAE | = Mean Absolute Error |
| MDL | = Method Detection Limit |
| MPN | = Most Probable Number |
| N.T.U | = Nephelometric Turbidity Unit |
| RMSE | = Root Mean Square Error |
| TC | = Total Coliforms |
| WHO | = World Health Organization |
AVAILABILITY OF DATA AND MATERIALS
The data supporting the finding of this study are provided in this paper.
ACKNOWLEDGEMENTS
Declared none.
Appendix A
| Date | Drinking water line | Physical Tests of Drinking Water | Bacteriological Tests for Drinking Water | |||||||||||||||||
|---|---|---|---|---|---|---|---|---|---|---|---|---|---|---|---|---|---|---|---|---|
| First Sampling Area | Second Sampling Area | Third Sampling Area | ||||||||||||||||||
| Turbidity NTU | Temp.°C | PH | E.C. MsLcm | Station | Residual chlorine |
MPN Total Coli/100ml |
MPN E. Coli/100ml |
Plate count | Station | Residual chlorine |
MPN Total Coli/100ml |
MPN E. Coli/100ml |
Plate count | Station | Residual chlorine |
MPN Total Coli/100ml |
MPN E. Coli/100ml |
Plate count | ||
| November | first line | 5 | 20 | 7 | 573 | Al-Wathba | 4 | 0 | 0 | 0 | Al-Amin | 2 | 0 | 0 | 0 | Jerf Al-Malh | 0.3 | 1.1 | 0 | 65 |
| second line | 4 | 20 | 7.5 | 595 | Al-Jbenat | 4 | 0 | 0 | 0 | Al-Huwaider | 3.5 | 0 | 0 | 0 | Al-Huwaider end | 1.5 | 0 | 0 | 0 | |
| Third line | 9 | 20 | 7.7 | 601 | Al-Wathba | 3.5 | 0 | 0 | 0 | New Baquba | 3.5 | 0 | 0 | 0 | Al-Mustafa neighborhood | 2 | 0 | 0 | 0 | |
| Fourth line | 7 | 18 | 7.6 | 568 | Al-Wathba | 3 | 0 | 0 | 0 | Al-Rahma | 1.5 | 0 | 0 | 25 | Al-Aqsa mosque | 0 | 1.1 | 0 | 205 | |
| Fifth line | 7 | 15 | 7.2 | 615 | Al-Wathba 4.5 |
4.5 | 0 | 0 | 0 | Al-Sikk | 2.5 | 0 | 0 | 0 | The end of Altahrir | 1 | 0 | 0 | 0 | |
| December | first line | 4 | 15 | 7.2 | 579 | Al-Wathba | 5 | 0 | 0 | 0 | Al-Amin | 4 | 0 | 0 | 0 | Jerf Al-Malh | 3 | 0 | 0 | 0 |
| second line | 25 | 13 | 7.5 | 595 | Al-Jbenat | 3 | 0 | 0 | 0 | Al-Huwaider | 2 | 0 | 0 | 0 | Al-Huwaider end | 0 | 1.1 | 0 | 200 | |
| Third line | 5 | 12 | 7.4 | 710 | Al-Wathba | 4.5 | 0 | 0 | 0 | New Baquba | 4 | 0 | 0 | 0 | Al-Mustafa neighborhood | 2.5 | 0 | 0 | 0 | |
| Fourth line | 6 | 14 | 7.5 | 702 | Al-Wathba | 4.5 | 0 | 0 | 0 | Al-Rahma | 2.5 | 0 | 0 | 0 | Al-Aqsa mosque | 2 | 0 | 0 | 0 | |
| Fifth line | 5 | 11 | 7 | 688 | Al-Wathba | 3 | 0 | 0 | 0 | Al-Sikk | 1.5 | 0 | 0 | 0 | The end of Altahrir | 1 | 0 | 0 | 0 | |
| January | first line | 30 | 10 | 6.8 | 575 | Al-Wathba | 2.5 | 0 | 0 | 0 | Al-Amin | 1 | 0 | 0 | 10 | Jerf Al-Malh | 1 | 0 | 0 | 25 |
| second line | 35 | 15 | 7.5 | 595 | Al-Jbenat | 3 | 0 | 0 | 0 | Al-Huwaider | 3 | 0 | 0 | 0 | Al-Huwaider end | 2 | 0 | 0 | 0 | |
| Third line | 35 | 17 | 7.4 | 692 | Al-Wathba | 3.5 | 0 | 0 | 0 | New Baquba | 1 | 0 | 0 | 0 | Al-Mustafa neighborhood | 0 | 1 | 0 | 250 | |
| Fourth line | 35 | 10 | 7.5 | 680 | Al-Wathba | 4 | 0 | 0 | 0 | Al-Rahma | 1 | 1.2 | 0 | 420 | Al-Aqsa mosque | 0 | 1 | 0 | 500 | |
| Fifth line | 50 | 18 | 6.9 | 715 | Al-Wathba | 2.5 | 0 | 0 | 0 | Al-Sikk | 0 | 0 | 0 | 110 | The end of Altahrir | 1 | 1.1 | 0 | 250 | |
| March | first line | 25 | 20 | 7.5 | 595 | Al-Wathba | 3 | 0 | 0 | 0 | Al-Amin | 2 | 0 | 0 | 110 | Jerf Al-Malh | 0 | 1.1 | 0 | 0 |
| second line | 7 | 27 | 6.8 | 622 | Al-Jbenat | 4.5 | 0 | 0 | 0 | Al-Huwaider | 4 | 0 | 0 | 0 | Al-Huwaider end | 2.5 | 0 | 0 | 0 | |
| Third line | 5 | 29 | 7.5 | 625 | Al-Wathba | 4 | 0 | 0 | 0 | New Baquba | 3 | 0 | 0 | 0 | Al-Mustafa neighborhood | 1.5 | 0 | 0 | 0 | |
| Fourth line | 5 | 33 | 7.5 | 645 | Al-Wathba | 3.5 | 0 | 0 | 0 | Al-Rahma | 1 | 0 | 0 | 0 | Al-Aqsa mosque | 0 | 0 | 0 | 0 | |
| Fifth line | 5 | 34 | 6.9 | 980 | Al-Wathba | 4 | 0 | 0 | 0 | Al-Sikk | 2 | 0 | 0 | 0 | The end of Altahrir | 1 | 0 | 0 | 0 | |
| April | first line | 7 | 33 | 6.8 | 622 | Al-Wathba | 4 | 0 | 0 | 0 | Al-Amin | 2 | 0 | 0 | 0 | Jerf Al-Malh | 0.3 | 0 | 0 | 210 |
| second line | 5 | 33 | 7.5 | 625 | Al-Jbenat | 3.5 | 0 | 0 | 0 | Al-Huwaider | 1 | 0 | 0 | 0 | Al-Huwaider end | 1.5 | 0 | 0 | 0 | |
| Third line | 5 | 33 | 7.5 | 645 | Al-Wathba | 3.5 | 0 | 0 | 0 | New Baquba | 1 | 0 | 0 | 0 | Al-Mustafa neighborhood | 0 | 0 | 0 | 0 | |
| Fourth line | 5 | 37 | 7.8 | 650 | Al-Wathba | 4 | 0 | 0 | 0 | Al-Rahma | 3.5 | 0 | 0 | 0 | Al-Aqsa mosque | 0.2 | 1.1 | 0 | 300 | |
| Fifth line | 5 | 40 | 6.9 | 980 | Al-Wathba | 4 | 0 | 0 | 0 | Al-Sikk | 2.5 | 0 | 0 | 0 | The end of Altahrir | 1 | 0 | 0 | 0 | |
| May | first line | 5 | 39 | 7.5 | 620 | Al-Wathba | 4 | 0 | 0 | 0 | Al-Amin | 1 | 0 | 0 | 0 | Jerf Al-Malh | 0.5 | 0 | 0 | 310 |
| second line | 5 | 40 | 7.5 | 780 | Al-Jbenat | 3.5 | 0 | 0 | 0 | Al-Huwaider | 3.5 | 0 | 0 | 0 | Al-Huwaider end | 1.5 | 0 | 0 | 0 | |
| Third line | 7 | 40 | 6.9 | 670 | Al-Wathba | 3.5 | 0 | 0 | 0 | New Baquba | 2 | 0 | 0 | 0 | Al-Mustafa neighborhood | 0 | 1.1 | 0 | 500 | |
| Fourth line | 5 | 41 | 6.8 | 700 | Al-Wathba | 4 | 0 | 0 | 0 | Al-Rahma | 1.5 | 0 | 0 | 0 | Al-Aqsa mosque | 0.5 | 1 | 0 | 350 | |
| Fifth line | 5 | 41 | 7.5 | 890 | Al-Wathba | 3.5 | 0 | 0 | 0 | Al-Sikk | 2 | 0 | 0 | 0 | The end of Altahrir | 1 | 0 | 0 | 0 | |
REFERENCES
[https://izlik.org/JA98AZ64JH]

