All published articles of this journal are available on ScienceDirect.

Monitoring Indoor Environmental Quality Changes in a Classroom: A Case Study
Authors Info & Affiliations
Abstract
Introduction
Indoor environmental quality (IEQ) is particularly important in classrooms, as students spend a significant portion of their time there. This study analyzes the variability of IEQ in a naturally ventilated classroom during the heating season. It assesses environmental quality using a newly developed 10-point IEQI index that integrates indoor air pollutant concentrations and thermal conditions.
Methods
Low-cost sensors were applied to continuously monitor typical indoor air pollutant concentrations and thermal condition parameters. The obtained results were used to calculate the Indoor Air Quality Index (IAQI) and the Thermal Condition Index (TCI), which served as the basis for determining the overall IEQ Index (IEQI). Variations in the IEQI were analyzed during periods of student occupancy, during the night, and throughout the entire monitoring period.
Results
When students were present in the classroom, pollutant concentrations, particularly CO2, increased significantly, with maximum values often exceeding 3300 ppm. Air temperature rose above 24°C. The calculated IAQI, TCI, and IEQI values were sensitive to occupancy fluctuations and varied throughout the day. IEQI values sometimes exceeded level 5, indicating relatively poor environmental quality at these times.
Discussion
The findings are consistent with previous studies that indicate that student presence negatively affects indoor environmental conditions in classrooms. The proposed IEQI, reflecting the dynamic interplay of occupancy, air pollution, and thermal conditions, allows for a relatively simple and ongoing assessment of environmental quality in classrooms. To fully evaluate its reliability, interpretability, and practical value, subjective validation of the IEQI is recommended.
Conclusion
Student presence significantly contributes to the deterioration of IEQ in the classroom. The proposed IEQI is a promising tool for monitoring and improving indoor environmental conditions not only in the studied classroom but also in similar spaces. By accounting for all relevant environmental parameters and conducting appropriate validation, this index can support the optimization of HVAC systems and the implementation of intelligent indoor environmental control strategies, thereby ensuring healthier, more comfortable conditions for students in classrooms.
1. INTRODUCTION
Indoor environmental quality (IEQ) defines the overall environmental conditions inside a building and is mainly affected by Indoor Air Quality (IAQ) and Thermal Conditions (TC). Other factors influencing IEQ include building architecture, lighting, acoustics, and HVAC system performance (CEN EN 16798, 2019). IAQ and TC have the greatest impact on human health, well-being, and cognitive performance. IAQ is most often assessed by measuring the concentrations of indoor air pollutants such as Particulate Matter (PM), Carbon Dioxide (CO2), Volatile Organic Compounds (VOCs), formaldehyde (CH2O), as well as biological agents (BLF, 2023). Elevated levels of those pollutants can adversely affect human health, especially given that people spend the majority of their time indoors. TC are typically described by physical parameters such as air Temperature (T), Relative Humidity (RH), and airflow velocity, which determine heat exchange between the human body and the surrounding environment (ISO 7730, 2005).
In most countries, people spend over 80% of their time indoors (van Grieken et al., 2024). The rise of remote work and online learning further increases the need to maintain a healthy indoor environment (Young et al., 2024). Poor IEQ has been associated with increased health risks, reduced productivity, and impaired learning performance (Liu et al., 2024; Mujan et al., 2019; Dimitroulopoulou et al., 2023; Fissore et al., 2023). This issue is particularly important in schools where children and adolescents spend considerable amounts of their time (Sadrizadeh et al., 2022; Wargocki et al., 2020). However, there are no specific regulatory standards for IEQ in schools; therefore, general exposure guidelines are often followed. The World Health Organization (WHO) provides a guideline for some indoor air pollutants. For CH2O, the recommended short-term exposure is below 0.1 mg/m3 (WHO, 2010). Values for other common pollutants are mainly based on established building guidelines and standards (e.g., CO2 < 1000 ppm, PM2.5 < 10 µg/m3, PM10 < 25 µg/m3, total VOCs < 200 µg/m3) (Dimitroulopoulou et al., 2023). Indoor air temperature (20–26°C) and relative humidity (30–60%) should be maintained at levels consistent with comfort requirements and indoor thermal environment standards (CEN EN 16798, 2019; ISO 7730, 2005).
Environmental monitoring in schools mainly focuses on IAQ and TC in classrooms, as these significantly affect students’ health, comfort, and cognitive performance. It provides key data for designing strategies to mitigate the impact of poor indoor conditions and improve the classroom environments, both for students and teachers.
Various IAQ and IEQ indexes have been developed aimed at simplifying the assessment. These indices vary in the number and types of included parameters, scaling methods, and interpretative formats. Some are based solely on pollutant concentrations (Wong et al., 2007; Wang et al., 2008; Mainka and Zajusz-Zubek, 2015; Wang et al., 2016; Koufi et al., 2017), other include thermal parameters (ISO 7730, 2005; Burek et al., 2006; Pereira et al., 2014; Li et al., 2016; Piasecki and Kostyrko, 2020), and some combine physical indicators with subjective assessments of comfort or health effects (Li et al., 2016; Sarbu and Sebarchievici, 2013). Further examples include indexes based on measurements of multiple pollutants in air-conditioned offices (Wong et al., 2007), adaptations of outdoor air quality index formulas for indoor use (Wang et al., 2008; US EPA, 2016), or comprehensive indicators that take into account temperature, noise, lighting, and user satisfaction (Li et al., 2016; Piasecki and Kostyrko, 2020; Sun et al., 2022).
To date, there is no widely accepted IEQ index for classroom environments – one that balances scientific validity with practical applicability. A suitable index should reflect both health-related risks and environmental comfort, while supporting operational decision-making in school buildings.
The main objective of this study is to present the variability of IEQ in a naturally ventilated classroom during the heating season and to evaluate it using a newly developed 10-point IEQ index, which integrates indoor air pollutant concentrations and thermal conditions. Additionally, the study aims to show the variations of the IEQ index when students are present in the classroom and at other defined monitoring periods.
2. METHODS
2.1. Study Site and Measurement Protocol
Measurements of indoor air pollutant concentrations and parameters influencing thermal conditions were conducted over a three-week period during the 2023/2024 heating season in one of the classrooms at the Lublin University of Technology, located in eastern Poland. The selected classroom was a rectangular room with a volume of 86m3, and was located on the third floor of one of the university buildings (Fig. 1). The room was naturally ventilated and heated by two panel radiators connected to a heat exchanger. Each radiator was equipped with a thermostatic valve set to maintain an indoor temperature of 20°C.
Regular classes with students were held in accordance with the university's weekly schedule, from Monday to Saturday, typically from 9:00a.m. to 4:00p.m. Each class lasted approximately 90 minutes and was followed by a 15-minute break. Each session involved 8 to 16 students, who were evenly distributed throughout the classroom.
2.2. Instrumentation and Data Acquisition
Measurements were carried out using a set of calibrated low-cost sensors placed in the central part of the room, 1.1 m above the floor. These sensors continuously measured and recorded, at 1-minute intervals, the concentrations of CO2, PM2.5, PM10, CH2O, and VOCs (expressed as total concentration in isobutylene equivalents), as well as indoor air Temperature (T), Relative Humidity (RH), and atmospheric Pressure (p). Technical specifications provided by the sensor manufacturers are summarized in Table 1. Additional air pollutants, such as nitrogen dioxide (NO2) and sulfur dioxide (SO2), were also monitored in the classroom but were excluded from the analysis presented in this study due to their relatively low concentrations and limited variability while students were present in the room. An indoor air microbiological analysis was also performed using impactor-based sampling; however, its results are not included in this study to maintain a focused scope.
2.3. Development and Calculation of the IEQ Index
The Indoor Environmental Quality Index (IEQI) was developed based on the measured concentrations of air pollutants affecting IAQ, together with data on air parameters affecting thermal conditions in the classroom. It should be noted that the term IEQI is limited in scope, as it does not account for all factors that may influence the overall indoor environmental quality. The IEQI calculation involved several intermediate steps, including the determination of the Indoor Air Quality Index (IAQI) and the Thermal Condition Index (TCI). The IAQI calculation methodology was adapted from the U.S. Environmental Protection Agency (EPA) procedure used to determine the Outdoor Air Quality Index (AQI) (US EPA, 2016), with appropriate modifications for indoor applications. The IAQI value for each considered indoor air pollutant was obtained using a linear interpolation approach, according to (Eq. 1).

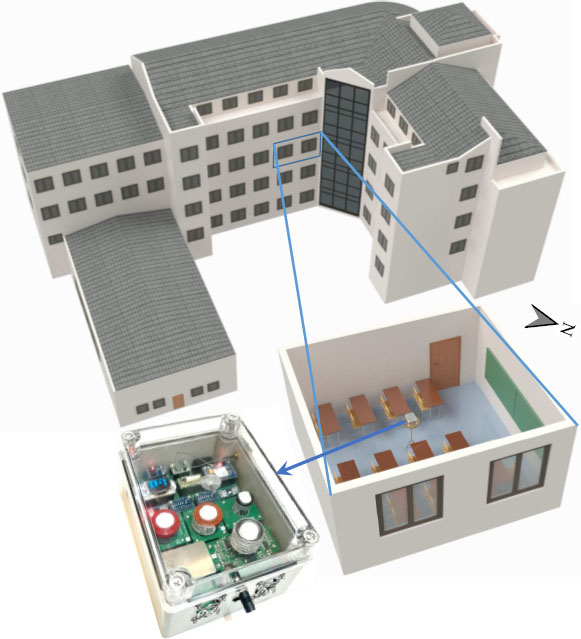
Schematic view of the university building with the monitored classroom, and a photo of the sensor setup used in the study.
| Parameter | Measurement Range | Accuracy | Resolution | Sensor Model |
|---|---|---|---|---|
| CO2 | 300–5000 ppm | ±50 ppm + 3% of reading | 1 ppm | Figaro CDM7160 |
| PM2.5 / PM10 | 0–500 µg/m3 | ±10 µg/m3 (0–100 µg/m3); ±10% of reading (100–500 µg/m3) |
1 µg/m3 | Plantower PMS5003 |
| CH2O | 0–10 ppm | ±0.1 ppm | 0.01 ppm | Mambrapor CH2O-C-10 |
| VOCs | 0–50 ppm | ±3% of reading | 1 ppb | Alphasense PID-AH2 |
| Temperature (T) | –40 to +85°C | ±0.5°C (0–65°C); ±1.25°C (–20 to 0°C); ±1.5°C (–40 to –20°C) |
0.01°C | Bosch BME280 |
| Relative humidity (RH) | 0–100% | ±3% (20–80%) | 0.008% | Bosch BME280 |
| Pressure (p) | 300–1250 hPa | ±1.0 hPa (300–1100 hPa, –20 to 0°C); ±1.5 hPa (1100–1250 hPa, –20 to 0°C); ±1.7 hPa (300–1100 hPa, below –20°C) | 0.18 Pa | Bosch BME280 |
where C is the pollutant concentration, Ch is the concentration breakpoint greater than or equal to C, Cl is the concentration breakpoint less than or equal to C, Ih is the index breakpoint corresponding to Ch, and Il is the index breakpoint corresponding to Cl.
The IAQI calculation was based on the 1-minute average of continuous concentration measurements of the five considered pollutants. This approach was essential due to the rapid air quality fluctuations in the classroom. Pollutant concentrations were converted into IAQI values using a 10-point scale (0–10), which is considered more intuitive and practical than alternative scales. Pollutant concentration breakpoints, their corresponding IAQI values, and the assigned air quality categories are presented in Table 2. These categories are color-coded to reflect increasing levels of health risk and are classified as follows: Good (0-2), Moderate (2-4), Poor (4-6), Unhealthy (6-8), and Hazardous (8-10).
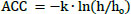
where h is the specific enthalpy of indoor air, calculated from measured T, RH, and p using standard psychrometric equations, and ho is the threshold specific enthalpy neutral for perception (i.e., when ACC = 0). The values of the coefficient k and ho are adopted from an empirical model (Burek et al., 2006), and are dependent on the RH and the level of indoor air pollution.
ACC values ranging from –1 (not acceptable air quality) to +1 (acceptable air quality) were applied to determine the percentage of dissatisfied students (PD), calculated using (Eq. 3) (Burek et al., 2017):

The PD values, calculated at 1-minute intervals, were divided by 10, and the results were adopted as the TCI. The TCI was also categorized on a 10-point scale, with 0 indicating very good quality and 10 indicating very poor quality.
As previously mentioned, the proposed IEQI combines the IAQI and TCI into a single index that can be determined using various calculation methods. This study considered four IEQI variants: the arithmetic mean (Mean IEQI), the root mean square (MS IEQI), the weighted mean (WM IEQI), and the average of the maximum IAQI and TCI values (Max IEQI). The individual IEQI values were calculated according to (Eqs. 4–9):

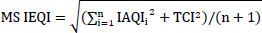


where:


and n is the number of considered pollutants.
3. RESULTS
3.1. Indoor Air Pollution Levels and Thermal Conditions
Table 3 shows basic statistical information regarding CO2, PM2.5, PM10, CH2O, and VOCs concentrations, as well as air temperature and relative humidity in the classroom, along with the correlation coefficients of these parameters during the entire measurement period, the presence of students, and nighttime hours (10:00p.m. to 6:00a.m.). Mean values and Standard Deviations (SD) are presented with two decimal places due to large sample sizes; sensor accuracies are provided in Table 1. Throughout the entire monitoring period, average PM and VOCs concentrations exceeded the values recommended in building guidelines and standards, which are typically 10 µg/m3 for PM2.5, 25 µg/m3 for PM10, and 0.062 ppm for VOCs (Dimitroulopoulou et al., 2023; van Grieken et al., 2024). For PM2.5 and VOCs, the average concentrations were nearly three times higher than the recommendations. The average temperature and relative humidity were within the comfort ranges, 20–24°C and 30–60%, respectively (ISO 7730, 2005; Liu et al., 2024). The results differed significantly during the measurement periods with the students present in the classroom. Exceedances were recorded not only for PM and VOCs concentrations but also for CO2 concentrations and temperature. CO2 concentrations often exceeded the maximum level of 3300 ppm detectable by the sensor used. During nighttime hours, exceedances occurred only for PM concentrations, which may have been related to the infiltration of polluted outdoor air. The local sources of aerosol particles were most likely exhaust fumes from solid fuel combustion in nearby private houses, which were responsible for this air pollution (Polednik, 2013). The presented correlation coefficients, significant at p < 0.001, show that in addition to their obvious values close to 1 for the related concentrations of PM2.5 and PM10 (PM2.5 is part of PM10), there were also positive correlation coefficients greater than 0.75 for temperature, relative humidity, and CO2 concentrations both during the presence of students and throughout the entire monitoring period. At nighttime, significantly high correlation coefficients (r > 0.92) were observed between CH2O and PM concentrations, which could be caused by infiltration of pollutants resulting from the combustion of solid fuels in nearby private houses.
| CO2 [ppm] |
PM2.5 [µg/m3] | PM10 [µg/m3] | CH2O [ppb] |
VOC [ppm] |
IAQI Range |
Color Code |
Air Quality Category |
|---|---|---|---|---|---|---|---|
| 0–400 | 0–10 | 0–15 | 0–30 | 0–0.05 | 0–1 |  |
Good |
| 400–600 | 10–20 | 15–25 | 30–50 | 0.05–0.1 | 1–2 |  |
|
| 600–1000 | 20–30 | 25–40 | 50–75 | 0.1–0.2 | 2–3 |  |
Moderate |
| 1000–1500 | 30–40 | 40–55 | 75–110 | 0.2–0.3 | 3–4 |  |
|
| 1500–2000 | 40–50 | 55–75 | 110–150 | 0.3–0.5 | 4–5 |  |
Poor |
| 2000–2500 | 50–60 | 75–95 | 150–200 | 0.5–0.8 | 5–6 |  |
|
| 2500–3000 | 60–80 | 95–120 | 200–300 | 0.8–1.3 | 6–7 |  |
Unhealthy |
| 3000–4000 | 80–100 | 120–150 | 300–500 | 1.3–2.0 | 7–8 |  |
|
| 4000–5000 | 100–150 | 150–200 | 500–800 | 2.0–3.0 | 8–9 |  |
Hazardous |
| >5000 | >150 | >200 | >800 | >3.0 | 9–10 |  |
| Mean | SD | CO2 [ppm] | PM2.5 [µg/m3] | PM10 [µg/m3] | CH2O [ppb] | VOC [ppm] | T [oC] |
RH [%] | |
|---|---|---|---|---|---|---|---|---|---|
| Entire Monitoring n = 9558 | |||||||||
| CO2 [ppm] | 880.73 | 690.95 | 1.00 | -0.18 | -0.19 | 0.24 | 0.53 | 0.77 | 0.75 |
| PM2.5 [µg/m3] | 28.19 | 17.56 | -0.18 | 1.00 | 0.995 | 0.22 | -0.13 | -0.34 | -0.56 |
| PM10 [µg/m3] | 33.70 | 21.56 | -0.19 | 0.995 | 1.00 | 0.22 | -0.14 | -0.35 | -0.56 |
| CH2O [ppb] | 25.78 | 17.20 | 0.24 | 0.22 | 0.22 | 1.00 | 0.75 | 0.12 | 0.07 |
| VOC [ppm] | 0.17 | 0.14 | 0.53 | -0.13 | -0.14 | 0.75 | 1.00 | 0.44 | 0.38 |
| T [oC] | 23.20 | 0.99 | 0.77 | -0.34 | -0.35 | 0.12 | 0.44 | 1.00 | 0.56 |
| RH [%] | 31.50 | 5.00 | 0.75 | -0.56 | -0.56 | 0.07 | 0.38 | 0.56 | 1.00 |
| Student Presence n = 1896 | |||||||||
| CO2 [ppm] | 1962.2 | 802.60 | 1.00 | -0.28 | -0.29 | 0.17 | 0.36 | 0.89 | 0.87 |
| PM2.5 [µg/m3] | 24.24 | 14.66 | -0.28 | 1.00 | 0.99 | -0.08 | -0.27 | -0.49 | -0.45 |
| PM10 [µg/m3] | 28.80 | 18.31 | -0.29 | 0.99 | 1.00 | -0.09 | -0.28 | -0.50 | -0.44 |
| CH2O [ppb] | 34.56 | 21.84 | 0.17 | -0.08 | -0.09 | 1.00 | 0.82 | 0.18 | 0.08 |
| VOC [ppm] | 0.27 | 0.22 | 0.36 | -0.27 | -0.28 | 0.82 | 1.00 | 0.39 | 0.32 |
| T [oC] | 24.15 | 1.14 | 0.89 | -0.49 | -0.50 | 0.18 | 0.39 | 1.00 | 0.84 |
| RH [%] | 37.75 | 4.51 | 0.87 | -0.45 | -0.44 | 0.08 | 0.32 | 0.84 | 1.00 |
| Nighttime n = 4215 | |||||||||
| CO2 [ppm] | 514.53 | 25.88 | 1.00 | 0.33 | 0.29 | 0.24 | 0.78 | 0.52 | -0.37 |
| PM2.5 [µg/m3] | 32.63 | 16.37 | 0.33 | 1.00 | 0.99 | 0.93 | 0.27 | -0.26 | -0.67 |
| PM10 [µg/m3] | 39.14 | 20.34 | 0.29 | 0.99 | 1.00 | 0.92 | 0.24 | -0.28 | -0.67 |
| CH2O [ppb] | 23.21 | 6.25 | 0.24 | 0.93 | 0.92 | 1.00 | 0.20 | -0.23 | -0.59 |
| VOC [ppm] | 0.12 | 0.01 | 0.78 | 0.27 | 0.24 | 0.20 | 1.00 | 0.56 | -0.54 |
| T [oC] | 22.83 | 0.36 | 0.52 | -0.26 | -0.28 | -0.23 | 0.56 | 1.00 | -0.15 |
| RH [%] | 28.61 | 3.34 | -0.37 | -0.67 | -0.67 | -0.59 | -0.54 | -0.15 | 1.00 |
3.2. Indoor Air Quality and Thermal Condition Indexes
Figure 2 shows the time series of the IAQI calculated from (Eq. 1) using the measured concentrations of CO2, PM2.5, PM10, CH2O, and VOCs, as well as the time series of TCI calculated from (Eqs. 2, 3) based on temperature and relative humidity in the classroom during monitoring. Periods when the classroom was occupied by students (O) and nighttime hours (N) are indicated. The graphs show that once the students entered the classroom, the IAQI, calculated based on CO2, CH2O, and VOCs concentrations, rapidly increased above level 5. On the other hand, values of IAQI calculated based on PM concentrations underwent only slight changes. They generally showed high values before the classes and then decreased to medium (~ 3) or even low levels (< 1). However, during nighttime monitoring, the indices occasionally exceeded 5. This can be explained by the predominance of filtration of inhaled aerosol particles and their deposition in students' lungs over the processes that generate and introduce these particles into the air in the classroom (Polednik, 2013). As for the changes in TCI, during the presence of students in the classroom, it increased from low (~ 1–2) to medium (~ 4). It should be noted that TCI values are always greater than 0, as the percentage of students dissatisfied with thermal conditions never equals 0, even under ideal conditions.
Statistical data corresponding to the graphs in Fig. (2) are summarized in Table 4. It includes the mean values, standard deviations, and correlation coefficients for IAQI associated with individual pollutants and for TCI throughout the entire monitored period, as well as separately for periods of student presence and nighttime hours.
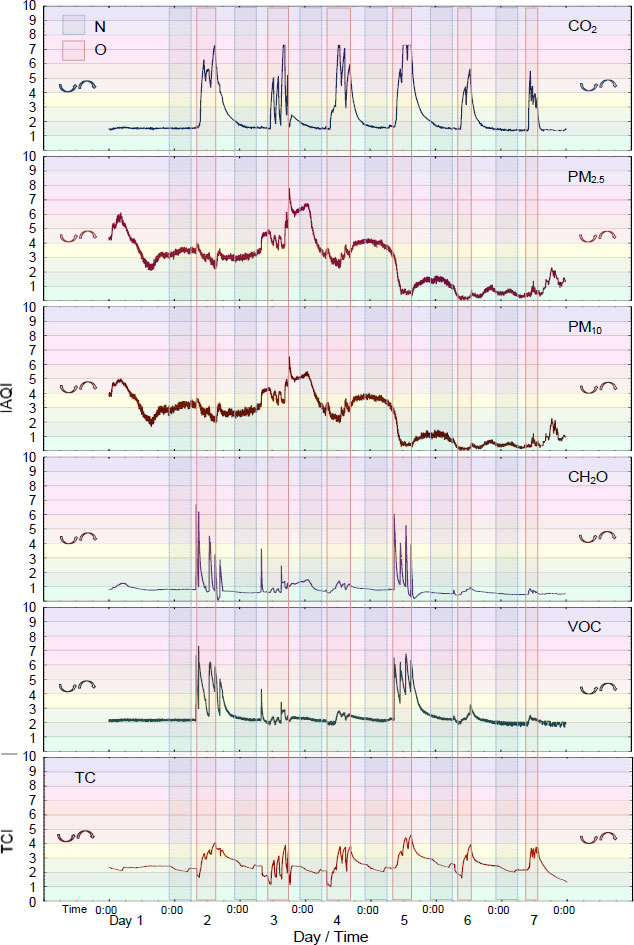
Time series of the Indoor Air Quality Indexes for individual pollutants (IAQI) and the Thermal Condition Index (TCI) in the classroom. N – nighttime, O – occupied by students.
| IAQI | Mean | SD | CO2 | PM2.5 | PM10 | CH2O | VOC | TCI |
|---|---|---|---|---|---|---|---|---|
| Entire Monitoring n = 9557 | ||||||||
| CO2 | 2.44 | 1.53 | 1.00 | -0.17 | -0.17 | 0.28 | 0.62 | 0.84 |
| PM2.5 | 2.80 | 1.70 | -0.17 | 1.00 | 0.99 | 0.22 | -0.13 | -0.34 |
| PM10 | 2.44 | 1.51 | -0.17 | 0.99 | 1.00 | 0.22 | -0.13 | -0.35 |
| CH2O | 0.88 | 0.60 | 0.28 | 0.22 | 0.22 | 1.00 | 0.70 | 0.16 |
| VOC | 2.52 | 0.87 | 0.62 | -0.13 | -0.13 | 0.70 | 1.00 | 0.57 |
| TCI | 2.55 | 0.58 | 0.84 | -0.34 | -0.35 | 0.16 | 0.57 | 1.00 |
| Student Presence n = 1895 | ||||||||
| CO2 | 4.87 | 1.58 | 1.00 | -0.28 | -0.28 | 0.16 | 0.43 | 0.90 |
| PM2.5 | 2.42 | 1.47 | -0.28 | 1.00 | 1.00 | -0.08 | -0.28 | -0.50 |
| PM10 | 2.14 | 1.34 | -0.28 | 1.00 | 1.00 | -0.09 | -0.28 | -0.50 |
| CH2O | 1.23 | 0.84 | 0.16 | -0.08 | -0.09 | 1.00 | 0.75 | 0.17 |
| VOC | 3.28 | 1.32 | 0.43 | -0.28 | -0.28 | 0.75 | 1.00 | 0.48 |
| TCI | 3.15 | 0.71 | 0.90 | -0.50 | -0.50 | 0.17 | 0.48 | 1.00 |
| Nighttime n = 4215 | ||||||||
| CO2 | 1.57 | 0.13 | 1.00 | 0.33 | 0.28 | 0.27 | 0.77 | 0.54 |
| PM2.5 | 3.24 | 1.58 | 0.33 | 1.00 | 0.99 | 0.91 | 0.30 | -0.27 |
| PM10 | 2.82 | 1.39 | 0.28 | 0.99 | 1.00 | 0.88 | 0.27 | -0.28 |
| CH2O | 0.78 | 0.23 | 0.27 | 0.91 | 0.88 | 1.00 | 0.23 | -0.24 |
| VOC | 2.18 | 0.12 | 0.77 | 0.30 | 0.27 | 0.23 | 1.00 | 0.56 |
| TCI | 2.31 | 0.20 | 0.54 | -0.27 | -0.28 | -0.24 | 0.56 | 1.00 |
3.3. Indoor Environmental Quality
The summary shows that the highest average IAQI values for CO2, CH2O, and VOCs, as well as the highest average TCI values, were obtained when students were present in the classroom. In contrast, the highest average IAQI values for PM were recorded during nighttime hours. At that time, IAQI values for CH2O, PM2.5, and PM10 exhibited strong correlations (r > 0.88). Throughout the entire monitoring period and during the student presence, positive correlation coefficients greater than 0.84 were observed between IAQI for CO2 and TCI values.
The time series of Mean IAQI, Max IAQI, Mean IEQI, MS IEQI, WM IEQI, and Max IEQI are presented in Fig. (3). It is evident that the highest values for both the mean and maximum IAQI and IEQI occurred during the student presence, while the lowest values were recorded during nighttime hours. When students were present, Max IAQI and Max IEQI sometimes exceeded levels 7 and 5, respectively, indicating episodes of seemingly poor air quality and environmental conditions in the classroom. During nighttime hours, the average values of these indexes remained around 3. Even though such values are relatively low, they may still be concerning as they can result from external air pollution and pollutant infiltration into the classroom, or suboptimal operation of the heating system.
4. DISCUSSION
4.1. Interpretation of Findings and Practical Applications
Our study supports and extends the previous findings, indicating that the presence of students adversely affects indoor comfort in classrooms. It is mainly associated with elevated concentrations of CO2 emitted by students, along with other pollutants linked to their presence (Baloch et al., 2020; Maciejewska and Szczurek, 2025). In addition, increases in temperature and humidity may also occur that further impact thermal conditions in classrooms (Pereira et al., 2014).
As previously mentioned, IEQ is a complex and multifaceted concept influenced by various factors. Therefore, any attempt to represent IEQ using a single aggregate numerical measure should be approached with caution (Coulby et al., 2014;, Riffelli, 2021; Pourkiaei and Romain, 2023). In light of this, the study proposes the utilization of two primary determinants of indoor comfort: air quality and thermal conditions. According to the European standard (CEN EN 16798, 2019), which defines requirements for indoor environmental parameters, visual and acoustic comfort are also of significance. However, these aspects were not considered in the present study, which focuses on air quality and thermal parameters. It should be noted that there is no consensus among researchers regarding which factors should be taken into account, how to weight them, or how to integrate them into a single index that allows for an objective, widely applicable classification and assessment of IEQ. Nevertheless, IAQ and TC remain the primary factors influencing IEQ in modern school classrooms, which usually provide adequate lighting and acceptable acoustic conditions (Bhandari et al., 2024; Makaremi et al., 2024; Meng and Zhang, 2025).
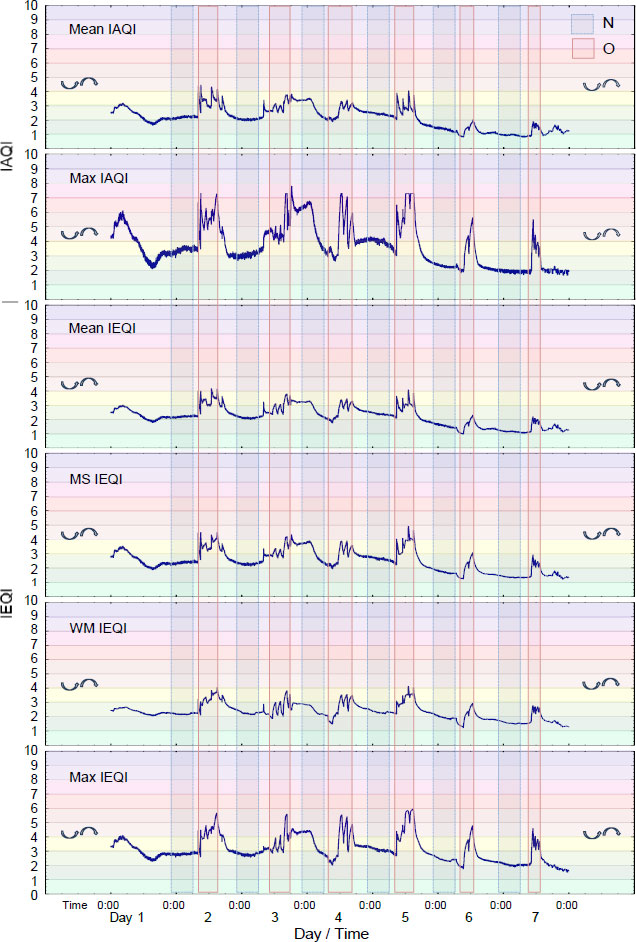
Time series of the mean Indoor Air Quality Index (Mean IAQI), Maximal Indoor Air Quality Index (Max IAQI), Mean Indoor Environment Quality Index (Mean IEQI), root Mean Square Indoor Environment Quality Index (MS IEQI), weighted mean square indoor environment quality. index (WM IEQI) and maximal indoor environment quality index (Max IEQI) in the classroom. N – nighttime, O – occupied by students.
The 10-point scale for IAQ, TC, and the IEQ indexes developed in this study is intuitive and easy to interpret, particularly when comparing values across different environmental conditions in the monitored classroom. Each averaging method considered in this study for calculating IEQI values offers distinct insights that are practically useful for indoor environment management. A rapid response to changes in classroom conditions could be facilitated by continuous monitoring of the proposed IEQI values, as it proved sensitive to variations in classroom occupancy. Such monitoring could also support decisions regarding heating and ventilation system upgrades or air conditioning implementation, thereby enhancing students' health and learning outcomes. In addition, this index could be applied to optimize indoor air treatment and improve the efficiency of ventilation or air conditioning control in the monitored classroom and similar indoor environments.
4.2. Limitations and Directions for Future Research
The newly developed assessment index can reflect changes in classroom environmental quality, but it has several limitations affecting its reliability and accuracy. As mentioned earlier, it considers only IAQ and TC, omitting other important factors such as lighting and acoustics. This study was based on short-term measurements in a single classroom, serving as a preliminary demonstration rather than a fully validated methodology. The consistent increase of IEQI values when students were present in the classroom supports the reliability of the index; however, more thorough validation is needed. To enhance the IEQI’s accuracy and usefulness, future research should compare it with established IEQ standards such as BREEAM (BRE Global, n.d.), WELL (International WELL Building Institute, 2020), and LEED (U.S. Green Building Council, n.d.), which consider a broader range of environmental factors. Incorporating surveys or questionnaires to gather students’ subjective perceptions would also help validate and refine the index. Additionally, the application of statistical methods such as Principal Component Analysis (PCA), Canonical Correlation Analysis (CCA), or Structural Equation Modeling (SEM) could help identify key relationships between environmental factors and perceived comfort, allowing for better weighting and overall enhancement of the IEQI. Finally, considering the results and limitations of this study, we recommend: (1) developing a modular version of the IEQI that incorporates lighting and acoustic parameters, (2) testing its applicability in various school types and climatic regions, and (3) evaluating its potential for real-time integration with smart ventilation or HVAC systems. These steps would significantly enhance the index’s usability and relevance in indoor environments.
CONCLUSION
Indoor environmental quality is negatively affected by student presence in the monitored classroom. The proposed 10-point IEQ index, which integrates indoor air pollutant concentrations and thermal condition parameters, is an objective tool for assessing environmental quality in classrooms. The continuous monitoring performed in the study showed notable fluctuations in IEQ and demonstrated that student occupancy influences CO2 levels, temperature, and relative humidity. When students were present in the classroom, IEQI values frequently exceeded level 5, indicating suboptimal conditions. Real-time tracking of the index could provide an opportunity to detect the deterioration of indoor environments at an early stage and support the implementation of timely corrective actions, including the optimization of HVAC system operation and application of intelligent indoor environment control strategies. Even though the index is currently limited to air quality and thermal conditions, it exhibits strong potential for adaptation, scalability, and broader application in similar indoor environments, provided that appropriate subjective validation is conducted. To sum up, the IEQI could offer a simple and effective method for assessing the quality of indoor school environments, promoting students’ well-being, cognitive performance, and long-term health.
AUTHORS’ CONTRIBUTIONS
The authors confirm their contribution to the paper as follows: B.P.: Study conception and design; L.G.: Data collection; A.P.: Writing - original draft preparation; A.B.: Writing - reviewing and editing. All authors reviewed the results and approved the final version of the manuscript.
LIST OF ABBREVIATIONS
| WHO | = World Health Organization |
| PM | = Particulate Matter |
| IEQ | = Indoor Environmental Quality |
| IEQI | = Indoor Environmental Quality Index |
| IAQ | = Indoor Air Quality |
| IAQI | = Indoor Air Quality Index |
| TC | = Thermal Condition |
| TCI | = Thermal Condition Index |
| ACC | = Acceptability of Air Quality |
| PD | = Percentage of Dissatisfied |
AVAILABILITY OF DATA AND MATERIALS
The data supporting the findings of this study are available from the corresponding author, BP, upon request.
ACKNOWLEDGEMENTS
The authors would like to thank Lublin University of Technology for providing access to the classroom and Dr. Sławomira Dumała for assistance with the measurements.

