All published articles of this journal are available on ScienceDirect.

Sociodemographic and Environmental Factors for Ill Health in Rwanda: Results from the 2016 Integrated Household Living Conditions Survey
Authors Info & Affiliations
Abstract
Introduction
A quarter of deaths are due to environmental factors worldwide, in Africa, and in Rwanda. Integrated Household Living Conditions Surveys (EICV) assess the living conditions of households. We sought to increase evidence on environmental factors in Rwanda.
Materials and Methods
We used a cross-sectional design to analyze the fifth EICV 5 conducted from October 2016 to October 2017, and conducted a multiple logistic regression to assess the prevalence of illness and environmental factors associated with disease in Rwanda.
Results
One-third of participants reported illness. Females (OR 1.26, 95% CI 1.22-1.33), over 65 years (OR 3.75, 95% CI 3.30-4.26), and affiliation with military medical insurance (OR=1.60, 95% CI: 1.14-2.23, p=0.006) indicated greater odds of disease. Using unimproved water sources (OR=1.47, 95% CI: 1.20-1.79, p<0.001), firewood for lighting (OR=1.28, 95% CI: 1.06-1.53, p=0.008), unimproved sanitation services (OR=1.72, 95% CI: 1.28-2.31, p<0.001), and occurrence of an environmental shock (OR=1.18, 95% CI: 1.18-1.39, p<0.001) showed higher odds of disease.
Discussion
Biological and social factors contribute to poorer health among females. Increased illness with age may be explained by aging-related changes. Higher odds of disease among military personnel might be due to the nature of their work. Increased odds of disease associated with non-improved drinking water sources reflect the drinking water ladder. We confirmed the harmful effects of wood consumption, the increased risk of illness across the sanitation ladder, and the association between environmental shocks and poor health.
Conclusion
Increased access to improved water sources, high-level sanitation services, and clean energy, reinforced disaster preparedness, and longitudinal studies are needed.
1. INTRODUCTION
Most diseases result from an interaction between genetic and environmental factors. Air pollution, inadequate water and sanitation, and harmful exposure to chemicals significantly impact health at both individual and population levels and contribute to infectious and noncommunicable diseases, such as respiratory and eye conditions, diarrhea, heart disease, and cancer (World Health Organization, 2020, 2018).
The World Health Organization (WHO) estimates that approximately 24% of deaths worldwide are due to a harmful environment.
Inadequate water, sanitation, and hygiene (WASH) practices are major contributors to the burden of disease, particularly among children under five in Sub-Saharan Africa. Every day, over 700 children under the age of five years die from diarrheal infections due to poor WASH on the African continent, with negative societal, public health, and economic consequences (Katoto et al., 2019; UNICEF, 2016). Ambient air pollution particularly affects children and the elderly. Wood fuel consumption and indoor cooking are among the key contributors to poor health in Africa (Sola et al., 2017).
Rwanda, located in Eastern Central Africa, has a population of 13.2 million. The country experiences an annual average of gross domestic product (GDP) growth of 8%. It is committed to developing a clean and green economy and achieving middle-income country status by 2035. Life expectancy was 69.6 years in 2022, reflecting gains in living conditions and health (Busokeye et al., 2022; National Institute of Statistics Rwanda, 2023a).
However, the country faces environmental health challenges, including contaminated food and water, inadequate hygiene practices, poor sanitation, and limited awareness of environmental health determinants. Additionally, over 80% of the population relies on firewood for cooking, contributing to indoor air pollution and associated health risks (Barstow et al., 2018; Ministry of Environment, 2019; Ministry of Health, 2008). Air pollution is the leading risk factor for death, accounting for 11% (over 10,000) of deaths in 2021 and a loss of 1.9% (USD 340 million) of the GDP in 2019 (Fisher et al., 2021; Health Effects Institute and Institute for Health Metrics and Evaluation, 2024).
Rwanda Integrated Household Living Conditions Surveys (EICV) are conducted every three years to provide information on the population’s well-being. The fifth EICV, conducted from October 2016 to October 2017, included a cross-sectional component to provide information on the living conditions of households (National Institute of Statistics Rwanda, 2018a).
Addressing environmental risk factors is one of the most efficient ways to advance population health. Globally, environmental improvements could prevent 13% to 37% of the burden of disease in countries. Progress in water supplies and sanitation has tremendously contributed to the health of populations worldwide. Water, sanitation, hygiene, and safer fuels for cooking could reduce child mortality by over 25% in the poorest nations (Bonita et al., 2006; Prüss-Üstün et al., 2008).
Despite the evidence demonstrating the impact of the environment on health globally and in high-income countries, there is limited evidence on this topic in Africa (Joubert et al., 2020). Further, most of the research on the interaction between environmental factors and health outcomes in Rwanda focused on children’s health (Ahishakiye, 2020; Das et al., 2018; Harerimana et al., 2016; Ishimwe et al., 2020; Mkama et al., 2024). Our study, therefore, sought to address this gap.
This study aims to determine the prevalence of illness among the general population and identify associated sociodemographic and environmental factors in Rwanda. Understanding these factors will contribute to the global discourse on environmental health and better inform policies to mitigate key environmental risks to improve the health of the population, with a focus on the-most vulnerable.
2. MATERIALS AND METHODS
The EICV 5 was conducted by the National Institute of Statistics of Rwanda (NISR) and used a cross-sectional household survey design.
A representative sample of 14,580 households was selected using a two-stage sampling design (National Institute of Statistics Rwanda, n.d.). The sample size of the original study was calculated to provide reliable estimates of key indicators at the national and district levels. This calculation considered the expected prevalence of key indicators, the desired level of precision, and the design effect due to the complex survey design. The estimates of the sampling errors and coefficients of variation for the poverty rate by district from the previous EICV4 data were examined to determine whether it would be necessary to adjust the sample size (Kelley, 2007; National Institute of Statistics Rwanda, 2018b).
In the first sampling stage, villages (the lowest administrative entities and primary sampling units) were selected from the Master Sample, based on the updated 2012 Census frame. These were stratified by district using a probability proportional to size (PPS) methodology. The sample frame of villages within each district was also ordered by urban and rural codes.
In the second stage, households (the secondary sampling units) were selected from the villages using systematic random sampling. Detailed sampling procedures are available in the original study reports on the NISR website (National Institute of Statistics of Rwanda, 2025).
The country comprises five provinces, 30 districts, 416 sectors, 2,148 cells, and 14,837 villages. As of 2016, approximately 72.1% of the population resided in rural areas, with nearly half (46.8%) engaged in market-oriented agriculture (Government of Rwanda, 2024; National Institute of Statistics Rwanda, 2023b).
The EICV 5 survey included all members of households nationwide. Eligibility criteria comprised persons currently living in the household. Household heads- man, woman, or a person aged over twelve years with comprehensive knowledge of all household members- were interviewed on behalf of all household members (National Institute of Statistics Rwanda, 2016).
Some of the sociodemographic and environmental variables collected through the EICV 5 were considered to assess their relationship with the main outcome variable of our study, which was the occurrence of any type of illness during the past four weeks.
The sociodemographic variables of our study included sex, age group, residence, economic status, highest educational level (for participants aged twelve years and over), health insurance type, marital status (for subjects aged twelve years and over), and occupation (for subjects aged over six years).
Males and females, participants of all age groups (0 to 15 years, 16 to 30 years, 31 to 45 years, 46 to 50 years, 51 to 65 years, and over 65 years), and study subjects living in rural or urban areas were included in our study.
The national poverty line was USD 141 (RWF 159,375) per adult equivalent per year, while the extreme poverty line was USD 93 (RWF 105,064) (National Institute of Statistics Rwanda, 2015). Participants of all economic status (non-poor, moderately poor, and extremely poor) were included in our study.
The education variable included participants aged twelve years and above. We excluded participants aged less than twelve years, and considered the expected age for completing primary school in Rwanda, as primary education sets the foundation for an individual’s development, health, and well-being (Ministry of Education of Rwanda, 2008; UNICEF, 2024).
The employment variable included four sub-categories, which were not mutually exclusive, as some study subjects might have more than one occupation. We excluded study subjects aged less than six years, and only considered children from the age of six, given that some might support their families in various projects outside school hours.
Environmental variables were included for all participants and related to the exposure of household members to environmental factors such as the main source of drinking water, distance from this main source, the type of fuel used for lighting and cooking, the location of the cooking space, the type of toilets, and the occurrence of an environmental shock during the past twelve months. All participants using either private piped water (available on premises), public piped water, a borehole, a protected or unprotected well, or spring, rainwater, river, lake, or another source of drinking water were considered in our study. We collected data on all subjects living at various distances (less than 100 m, between 100 to 300 m, between 300 to 600 m, between 600 to 900 m, and over 900 m) from the main source of drinking water. Participants using either the electricity grid, solar panel(s), torch or phone, batteries, oil lamps, candle, lantern, or firewood as the main source of lighting were all included in the study. Similarly, we considered all study participants who used firewood, charcoal, gas, electricity, or other fuel for cooking. The subjects of which kitchen was located at various places in the compound (outdoor, in a separate dwelling, in a sleeping area (or not), or in another place were all included in the research. Further, all types of sanitation (flush toilet, pit latrine- with or without a solid slab, open defecation, or other) were included in the analysis. The absence or occurrence of an environmental disaster, such as a flood, landslide, heavy rain, or other events, was also recorded for all participants.
In the primary study, the household head was interviewed using a standardized questionnaire in either Kinyarwanda or English (National Institute of Statistics Rwanda, 2018c). This individual provided detailed information about all household members.
The questionnaire comprised ten sections, covering various aspects such as household demographics, health, education, housing, and services related to water, electricity, and sanitation.
The data was collected from October 2016 to October 2017 by a team of enumerators, data-processing personnel, and field supervisors. The day before the interviews, data collectors visited the households. They explained the survey methodology to the head of the household and delivered a letter confirming the household’s selection for the study, seeking their consent to participate. Data collectors used tablets to conduct computer-assisted personal interviews (CAPI) (National Institute of Statistics Rwanda, n.d.). This method is suitable for conducting interviews using electronic tools and increasing the effectiveness and data quality of data collection (Squires et al., 2012).
We conducted a secondary analysis of the EICV cross-sectional data using Stata Special Edition 15.1 (National Institute of Statistics Rwanda, 2018a). The original survey comprised 35 datasets on households, persons, sociodemographic features, living conditions, employment, expenditures, and economic conditions. Each household and individual had a unique identifier. We merged the datasets related to households and persons using a one-to-many match merge (Stata, 2023a).
We then explored relevant information on households and individuals using frequencies and descriptive statistics to identify outliers, missing data, and to test for statistical assumptions (Shreffler and Huecker, 2024). Univariate analyses were conducted to assess the association between the main outcome variable - the presence of illness during the past four weeks - and independent demographic and environmental risk factors using Pearson’s chi-squared tests at a significance level of 0.05 (McHugh, 2013).
Logistic regression was employed to identify significant sociodemographic and environmental factors associated with ill health. This method is appropriate for binary outcome variables and estimates odds ratios, which provide insights into the strength and direction of associations between predictors and the outcome variable. The choice of logistic regression was guided by the study objectives, and to control for potential confounders (Peng et al., 2002).
Statistically significant variables from univariable analyses were retained to build a multiple logistic regression model. Variables included in the model had to meet the following criteria: (i) a plausible relationship of the variable with the outcome, based on the current knowledge; (ii) a response rate of 80% or higher; and (iii) the absence of correlation between variables (Shrestha, 2020).
We applied analytical weights in frequency analyses and logistic regression to maintain sample size (Amaral, 2017; Stata, 2023b).
The use of the CAPI ensured a high response rate of 100% for all variables (Brahme et al., 2018). Household heads had the option to participate in the study before the interview, and all of them agreed to be interviewed on behalf of their households. Consequently, all respondents provided complete information for all questions, resulting in no missing data.
Verbal consent was obtained from the head of each household by the data collector the day before the interview during the primary data collection. The anonymized dataset used for our secondary analysis was requested from the National Institute of Statistics of Rwanda (NISR) viaan online questionnaire. No further ethical approval was required due to the nature of this secondary analysis of EICV 5 data using an anonymized dataset.
3. RESULTS
The study included a total of 14,580 households, consisting of 63,314 individual members. The response rate was 100%, as all 14,580 heads of the selected households agreed to be interviewed.
Female participants represented 52.0% (n=33,880). Most participants (83.6%, n=52,449) lived in rural areas. About 62.3% (n=40,090) of participants were non-poor. The median age of individuals was 19 years (range 9-34 years), with children aged less than 15 years representing the largest age group at 43.2%. Approximately 56.2% of subjects over twelve years had completed at least a class at the primary level of education. Most (70.0%, n=44,478) were enrolled in community-based health insurance. About 45.3% of participants aged over twelve years were single. Nearly half (47.4%) of participants were independent small-scale farmers Table 1.
| Household Members Characteristics | Number (%) |
|---|---|
| Sex | 64,314 (100%) |
| Male | 30,880 (48.0%) |
| Female | 33,434 (52.0%) |
| Residence | 64,314 (100%) |
| Urban | 11,865 (18.4%) |
| Rural | 52,449 (83.6%) |
| Economic status | 64,314 (100%) |
| Non-poor | 40,090 (62.3%) |
| Moderate poverty | 14,110 (22.0%) |
| Severe poverty | 10,114 (15.7%) |
| Age groups (years) | 64,314 (100%) |
| 0-15 | 27,779 (43.2%) |
| 16-30 | 17,116 (26.7%) |
| 31-45 | 10,748 (16.7%) |
| 46-50 | 2,080 (3.2%) |
| 51-65 | 4,579 (7.1%) |
| >65 | 2,012 (3.1%) |
| Highest educational level (for participants aged twelve years and above) | 48,078 (74.7%) |
| No formal education | 10,680 (22.2%) |
| Pre-primary | 973 (2.0%) |
| Primary | 27,033 (56.2%) |
| Secondary/post-primary | 7,926 (16.6%) |
| University | 1,466 (3.0%) |
| Health insurance status | 64,314 (100%) |
| Rwanda Medical Insurance (RAMA) | 2,030 (3.2%) |
| Community-based health insurance (CBHI) | 44,478 (70.0%) |
| Military Medical Insurance (MMI) | 583 (0.9%) |
| Other health insurance | 463 (0.7%) |
| None | 16,760 (26.1%) |
| Marital status (for participants aged twelve years and above) | 43,240 (67.2%) |
| Single | 19,610 (45.3%) |
| Cohabitation | 1,255 (2.9%) |
| Married | 17,941 (41.5%) |
| Polygamous marriage | 644 (1.5%) |
| Separated | 1,042 (2.4%) |
| Divorced | 81 (0.2%) |
| Widowed | 2,667 (6.2%) |
| Occupation (among household members aged six and over) | Some participants have several jobs, categories not mutually exclusive |
| Independent (small-scale) farmer | 53,666 (83.4%) |
| Yes | 25,417 (47.4%) |
| No | 28,249 (52.6%) |
| Worker for a salary in the non-farm sector | 53,666 (83.4%) |
| Yes | 11,008 (20.5%) |
| No | 42,658 (79.5%) |
| Owner of an independent non-farm business | 53,666 (83.4%) |
| Yes | 6,187 (11.5%) |
| No | 47,479 (88.5%) |
| Worker in an independent non-farm business | 53,666 (83.4%) |
| Yes | 894 (1.7%) |
| No | 52,772 (98.3%) |
Almost 40% of subjects (n=25,237) used a protected well or spring as the main source of drinking water. Nearly one third (30.0%, n=19,298) lived at more than 900 meters from the main drinking water source. Most participants (42.3%, n=27,202) used torches and mobile phones as main lighting sources. Over 80% (n=52,890) used firewood for cooking. Most subjects (85.2%, n=54,823) lived in houses with pit latrines with solid slabs. Nearly a sixth (14.7%) of participants had been affected by environmental shocks during the past twelve months, with heavy rains and landslides being the most common Table 2.
| Environmental Characteristics | Number (%) |
|---|---|
| Main source of drinking water | 64,314 (100%) |
| Piped water (private) | 6,232 (9.7%) |
| Piped water (public) | 15,313 (23.8%) |
| Borehole | 1,588 (2.5%) |
| Protected well or spring | 25,237 (39.2%) |
| Unprotected well or spring | 5,926 (9.2%) |
| Rainwater | 309 (0.5%) |
| River or lake | 9,215 (14.3%) |
| Other | 493 (0.8%) |
| Distance from the main source of water | 64,314 (100%) |
| Less than 100 m | 4,406 (6.9%) |
| Between 100-300 m | 16,750 (26.0%) |
| Between 300-600 m | 12,379 (19.2%) |
| Between 600-900 m | 11,480 (17.9%) |
| Over 900 m | 19,298 (30.0%) |
| Main source of lighting | 64,314 (100%) |
| Electricity grid | 17,757 (27.6%) |
| Solar panel | 5,607 (8.7%) |
| Torch/phone | 27,202 (42.3%) |
| Batteries, other | 4,873 (7.6%) |
| Oil lamp, candle, or lantern | 6,875 (10.7%) |
| Firewood | 2,000 (3.1%) |
| Primary source of cooking fuel | 64,314 (100%) |
| Firewood | 52,890 (82.2%) |
| Charcoal | 10,125 (15.7%) |
| Gas/biogas | 634 (1.0%) |
| Electricity | 11 (0.0%) |
| Others | 654 (1.0%) |
| Location of cooking space | 64,314 (100%) |
| Outdoor | 11,688 (18.2%) |
| Separate dwelling | 37,477 (58.3%) |
| In dwelling, not in a sleeping area | 11,265 (17.5%) |
| In dwelling, in a sleeping area | 3,035 (4.7%) |
| Others | 849 (1.3%) |
| Type of toilet | 64,314 (100%) |
| Flush toilet | 1,444 (2.2%) |
| Pit latrine (with solid slab) | 54,823 (85.2%) |
| Pit latrine (without slab) | 6,057 (9.4%) |
| Other | 112 (0.2%) |
| No toilet (open defecation) | 1,878 (3.0%) |
| Environment-related challenge affecting the household during the past twelve months | 64,314 (100%) |
| Yes | 8,922 (13.9%) |
| No | 55,392 (86.1%) |
| If yes, type of environment-related challenge faced by the household during the past twelve months | 9,423 (14.7%) |
| Flood | 609 (6.4%) |
| Landslide | 2,165 (23.0%) |
| Heavy rain | 5,154 (54.7%) |
| Other | 1,495 (15.9%) |
About 32.5% (n=20,906) of participants reported being ill during the past month. The association between the outcome variable and the demographic variables and environmental risk factors was assessed using univariate analysis. All sociodemographic and environmental variables were significantly associated with the presence of disease, with a p-value less than 0.001 (Fig. 1).
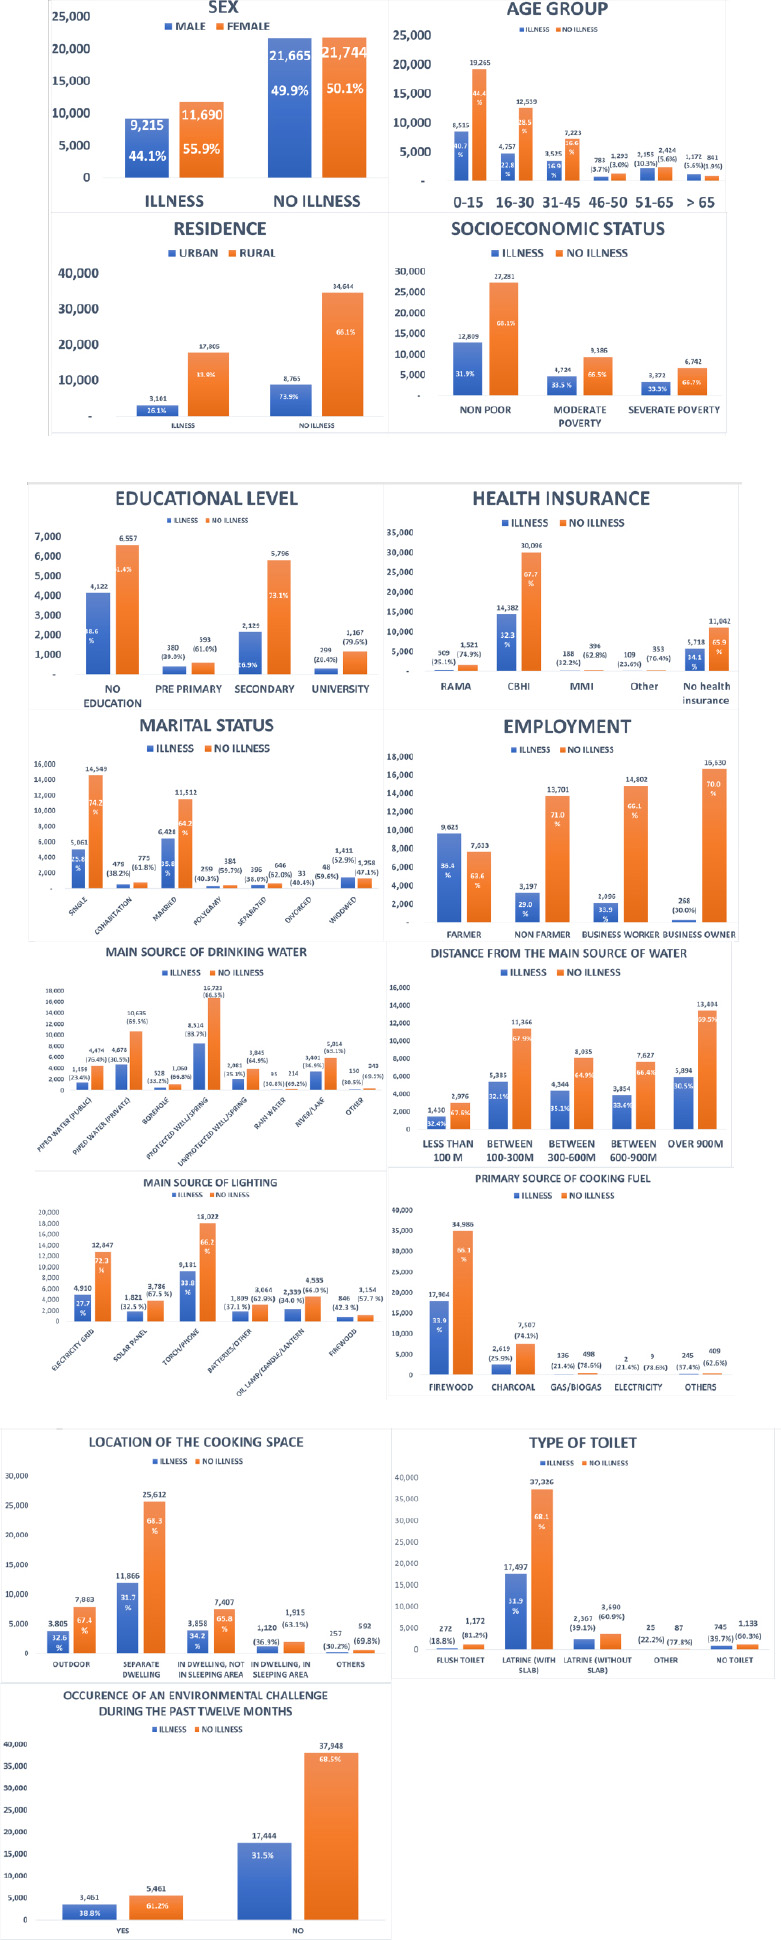
Distribution of sickness episodes during the past four weeks among study participants (socio-demographic and environmental characteristics).
A multiple logistic regression model was built using the independent variables that met the criteria for inclusion. The following sociodemographic and environmental characteristics were included in the model: age group, residence, socioeconomic status, health insurance, occupation, main source of drinking water, distance from the main source, type of fuel used for lighting and cooking, location of cooking space, type of toilets, and occurrence of any environmental shock.
Females had significantly greater odds of being sick than males (OR=1.26, 95% CI: 1.22-1.33, p<0.001). The odds of being sick increased with age, with the highest odds among participants over 65 years (OR=3.75, 95% CI: 3.30-4.26, p<0.001). Subjects enrolled in the Medical Military Insurance had significantly greater odds of disease than those enrolled in the Rwanda Medical Insurance (OR=1.60, 95% CI: 1.14-2.23, p=0.006).
Compared to participants who used a private piped water source, those who used a protected well or spring (OR=1.24, 95% CI: 1.03-1.48, p=0.022), an unprotected well or spring (OR=1.31, 95% CI: 1.07-1.61, p=0.009), or water from rivers or lakes (OR=1.47, 95% CI: 1.20-1.79, p<0.001) had higher odds of disease. Household members who used firewood (OR=1.28, 95% CI: 1.06-1.53, p=0.008) or batteries (OR=1.25, 95% CI: 1.09-1.44, p=0.001) for lighting had higher odds of disease compared to those who used electricity. Participants who used pit latrines with a solid slab (OR=1.35, 95% CI: 1.02-1.78, p=0.033), pit latrines without a slab (OR=1.72, 95% CI: 1.28-2.31, p<0.001), or had no toilet (OR=1.68, 95% CI: 1.23-2.29, p=0.001) had higher odds of disease compared to those who used flush toilets. Household members affected by an environmental shock during the past twelve months were more likely to have disease (OR=1.18, 95% CI: 1.18-1.39, p<0.001) Table 3.
4. DISCUSSION
Sociodemographic characteristics significantly associated with illness included being female, older than 15 years, or being enrolled in the Military Medical Insurance. Additionally, drinking water from a well, a spring, a river, or a lake, using firewood or batteries for lighting, and open defecation or pit latrines were linked to higher disease prevalence. Participants affected by recent environmental shocks also exhibited greater odds of illness.
| Variable | Odds ratio (OR) | Confidence interval (CI) | p-value |
|---|---|---|---|
| Sex | - | - | - |
| Male | 1 | - | - |
| Female | 1.26 | 1.22-1.33 | <0.001 |
| Age group | - | - | - |
| 0-15 | 1.00 | - | - |
| 16-30 | 1.08 | 1.00-1.16 | 0.037 |
| 31-45 | 1.45 | 1.33-1.58 | <0.001 |
| 46-50 | 1.74 | 1.53-1.97 | <0.001 |
| 51-65 | 2.45 | 2.21-2.72 | <0.001 |
| >65 | 3.75 | 3.30-4.26 | <0.001 |
| Residence | - | - | - |
| Urban | 1 | - | - |
| Rural | 1.12 | 0.96-1.29 | 0.140 |
| Socio-economic status | - | - | - |
| Non poor | 1.00 | - | - |
| Moderate poverty | 0.95 | 0.83-1.00 | 0.197 |
| Severe poverty | 0.91 | 0.83-1.00 | 0.059 |
| Health insurance type | - | - | - |
| Rwanda Medical Insurance (RAMA) | 1 | - | - |
| Community-based health insurance (CBHI) | 1.14 | 0.94-1.36 | 0.191 |
| Military Medical Insurance (MMI) | 1.60 | 1.14-2.23 | 0.006 |
| Other health insurance | 0.92 | 0.61-1.37 | 0.676 |
| None | 1.13 | 0.93-1.38 | 0.226 |
| Occupation | - | - | - |
| Independent (small-scale) farmer | - | - | - |
| Yes | 1 | - | - |
| No | 0.97 | 0.91-1.04 | 0.426 |
| Worker in the non-farm sector | - | - | - |
| Yes | 1 | - | - |
| No | 1.04 | 0.98-1.10 | 0.244 |
| Owner of an independent non-farm business | - | - | - |
| Yes | 1 | - | - |
| No | 0.96 | 0.89-1.03 | 0.223 |
| Worker in an independent non-farm business | - | - | - |
| Yes | 1 | - | - |
| No | 1.11 | 0.93-1.34 | 0.237 |
| Main source of drinking water | - | - | - |
| Piped water (own premises- private) | 1 | - | - |
| Piped water (public) | 1.14 | 0.95-1.36 | 0.168 |
| Borehole | 1.21 | 0.87-1.69 | 0.257 |
| Protected well or spring | 1.24 | 1.03-1.48 | 0.022 |
| Unprotected well or spring | 1.31 | 1.07-1.61 | 0.009 |
| Rainwater | 1.04 | 0.65-1.68 | 0.859 |
| River or lake | 1.47 | 1.20-1.79 | <0.001 |
| Other | 1.17 | 0.86-1.11 | 0.313 |
| Distance from the main source of water | - | - | - |
| Less than 100 m | 1 | - | - |
| Between 100-300 m | 0.96 | 0.85-1.10 | 0.566 |
| Between 300-600 m | 1.05 | 0.91-1.21 | 0.473 |
| Between 600-900 m | 0.97 | 0.84-1.12 | 0.652 |
| Over 900 m | 0.97 | 0.83-1.12 | 0.648 |
| Main source of lighting | - | - | - |
| Electricity grid | 1 | - | - |
| Solar panel | 1.04 | 0.91-1.20 | 0.560 |
| Torch/phone | 1.03 | 0.93-1.15 | 0.581 |
| Batteries, other | 1.25 | 1.09-1.44 | 0.001 |
| Oil lamp, candle, or lantern | 1.09 | 0.96-1.24 | 0.186 |
| Firewood | 1.28 | 1.06-1.53 | 0.008 |
| Primary source of cooking fuel | - | - | - |
| Gas/biogas | 1 | - | - |
| Electricity | 0.54 | 0.97-3.04 | 0.488 |
| Charcoal | 0.98 | 0.63-1.51 | 0.923 |
| Firewood | 1.10 | 0.69-1.76 | 0.674 |
| Others | 1.35 | 0.76-2.37 | 0.303 |
| Location of cooking space | - | - | - |
| In dwelling, not in a sleeping area | 1 | - | - |
| Outdoor | 1.04 | 0.93-1.16 | 0.512 |
| Separate dwelling | 0.95 | 0.87-1.03 | 0.209 |
| In dwelling, in a sleeping area | 1.07 | 0.94-1.22 | 0.285 |
| Others | 1.01 | 0.76-2.37 | 0.303 |
| Type of toilet | - | - | - |
| Flush toilet | 1 | - | - |
| Pit latrine (with solid slab) | 1.35 | 1.02-1.78 | 0.033 |
| Pit latrine (without slab) | 1.72 | 1.28-2.31 | <0.001 |
| Other | 0.59 | 0.33-1.10 | 0.098 |
| No toilet (open defecation) | 1.68 | 1.23-2.29 | 0.001 |
| Environment-related challenge affecting the household during the past twelve months | - | - | - |
| No | 1 | - | - |
| Yes | 1.28 | 1.18-1.39 | <0.001 |
Women reported significantly higher illness rates than men, consistent with studies from Sub-Saharan Africa, Europe, and Asia, which suggest that biological and social determinants, including employment and education gaps and gender role-related risks, contribute to poor health outcomes among women (Anson et al., 1993; Boerma et al., 2016; Idler, 2003). Further, in a systematic review, Ho et al. demonstrated that women and girls in developing countries are usually expected to collect water or solid fuels, which may result in increased musculoskeletal and mental health conditions, including a greater risk of sexual violence. Gender inequality in domestic chores also impedes access to education, which is another key social determinant of health (Ho et al., 2021; Njoh et al., 2018). Gender-sensitive environmental health policies and interventions, such as women’s empowerment and investment in safe WASH and cleaner cooking fuels, are therefore recommended to foster public health and gender equality (Odo et al., 2021; Ray and Smith, 2021).
Our study found that the likelihood of illness increased with age, and individuals over 65 years had 3.75 times higher odds of illness compared to those under 15 years. This might be partly explained by aging-related changes, as increased disease risk contributes to a higher illness burden among older populations globally, with a notable decline in functioning from age 60 (Jaul and Barron, 2017; World Health Organization, 2015). Older populations share a greater vulnerability to increased temperatures, water shortages, and food insecurity, as demonstrated by Katsaros et al. in a multi-country analysis (Katsaros et al., 2024).
However, environmental health challenges, such as air pollution and inadequate WASH, usually affect children and older adults (Hutton and Chase, 2016). The absence of a statistical association between illness and the youngest age group in this study may be partly explained by the broad definition of illness, which included any condition that had occurred during the past four weeks. Our findings underscore the need to mitigate environmental risk factors associated with major diseases throughout the life course. For instance, a study conducted in rural China found that increasing access to clean fuel for the elderly was associated with improved health outcomes, such as a reduction in chronic pain and better social interactions (Chen et al., 2023). Improved WASH access was also recommended to enhance the quality of life of older persons in Ghana (Dako-Gyeke et al., 2024).
Military personnel and their families enrolled with the Military Medical Insurance (MMI) reported higher odds of illness than participants covered by Rwanda Medical Insurance (RAMA). This may be due to the nature of military work, which involves higher risks of illness or injury, as shown in studies conducted in the United States, while RAMA usually enrolls office workers, who are less at risk of illness (Armed Forces Health Surveillance Division, 2024; Boersma et al., 2021; Chemouni, 2018). However, a systematic review of studies from the United States, the United Kingdom, Australia, and New Zealand reported an under-utilization of mental health services by the military due to stigma (Sharp et al., 2015). The limited data on military personnel’s health in other contexts highlights the need for further research in more diverse settings.
Compared to piped water available on premises, the odds of disease were highest among participants using non-improved drinking water sources such as surface water from rivers or lakes, or non-protected wells or springs, which indicated odds of 1.47 and 1.31, respectively. On the contrary, the odds for disease among participants using an improved drinking water source, such as protected wells or springs, boreholes, public piped water, and rainwater, were 1.24, 1.21, 1.14, and 1.04, respectively. Our findings reflect the drinking water ladder (World Health Organization, 2017). They align with the knowledge that increased access to regulated piped water and safe storage methods significantly improves health and is consistent with findings from low-income nations. The lower odds of disease (OR=1.04) observed among study subjects using rainwater for drinking compared to public piped water (OR=1.14) could be partly explained by differences in storage methods (Amrose et al., 2015; World Health Organization, 2023).
Using firewood (OR= 1.28) or batteries (OR= 1.25) for lighting was significantly associated with higher odds of illness than electricity. This reflects the well-documented harmful health effects of wood consumption, such as acute respiratory infections, lung and eye conditions, and cardiovascular and pulmonary diseases. Increased rural electrification is, therefore, needed (Piabuo and Tieguhong Puatwoe, 2020). Further, the use of batteries has been associated with safety, environmental, and health challenges. The use of solar grids could thus be explored to prevent such threats, where electricity is not available (Schismenos et al., 2021).
The absence of toilets (OR=1.68), and the use of pit latrines, without (OR=1.72) or with (OR=1.35) a slab, were associated with higher illness odds than flush toilets. Similar studies indicated an increased illness risk across the sanitation ladder, with open defecation posing the highest risk, followed by unimproved (latrines without a slab) and improved sanitation (latrines with a slab) (Cheng et al., 2018; World Health Organization and UNICEF, 2021). This highlights the importance of improving access to high-level sanitation services, particularly for the poorest and most vulnerable populations. In our study, unimproved sanitation showed slightly higher odds of diseases than the absence of toilets. This might be due to factors that were not explored. For instance, open defecation might still be practiced even when latrines are available, resulting in potential confounding (Garn et al., 2017; Skelly et al., 2012).
Households affected by environmental shocks had higher illness odds than those unaffected. Floods, heavy rains, and landslides have been associated with disease outbreaks, soil contamination, and physical and mental health distress (Alderman et al., 2012; Iain TRet al., 2015; Wudan, 2018). Our findings call for increased disaster preparedness, including integrating innovative methods, such as Artificial Intelligence (AI), into emergency systems for more accurate predictions (Poorani et al., 2024; Rehan, 2022).
This study has several strengths:
- Nationally Representative Sample: The fifth Integrated Household Living Conditions Survey (EICV 5) included a countrywide representative sample of 63,314 participants. This large sample size enhances the generalizability of the findings to the entire population of Rwanda.
- Comprehensive Data Collection: The EICV 5 survey collected detailed information on a wide range of sociodemographic and environmental factors. This comprehensive data allowed for a thorough analysis of the various determinants of ill health in Rwanda.
- High Response Rate: The study achieved a 100% response rate, with all selected household heads agreeing to participate. The use of CAPI for data collection minimized the risk of non-response bias, ensured that the findings were reflective of the target population, and achieved a 100% completeness rate for each variable.
- Robust Statistical Analysis: Multiple logistic regression models enabled the assessment of significant sociodemographic and environmental factors associated with ill health. The application of analytical weights in frequency analyses and logistic regression helped maintain the accuracy and reliability of the results.
- Policy-Relevant Findings: Our study addresses literature gaps related to the prevalence of illness among the general population and the association between sociodemographic and environmental factors with illness in Rwanda. To the best of our knowledge, this is the first nationally representative study of this kind in Rwanda. Most vulnerable population groups, such as women, the elderly, and most-at-risk professions, such as the military, were identified as more prone to illness. Our findings illustrated the WASH ladder, with increased odds of diseases among participants using unimproved water sources or unimproved sanitation facilities. Further, the use of firewood for lighting was identified as a key factor for disease, along with a recent environmental shock. This research contributes to the available literature and provides valuable insights to inform the development of targeted interventions to prevent environmental health risks and improve population health in Rwanda.
Despite the study’s strengths, it includes the following limitations:
- Secondary Data Analysis: The study is based on secondary data analysis, which depends on the initial design and data collection methods of the primary survey. The original survey was not specifically designed to address all the research questions of this study, which may limit the availability of certain variables and the depth of analysis.
- Cross-sectional Design: The cross-sectional design does not allow for causal inferences. These limitations highlight the need for longitudinal studies to establish causality and collect more detailed data on environmental health determinants.
- Self-reported Health Outcomes: The study relies on self-reported data for the presence of illness, which may be subject to recall bias and reporting inaccuracies. Participants may underreport or overreport their health status, leading to potential misclassification of health outcomes.
- Potential Confounding Factors: While the study controlled for several sociodemographic and environmental variables, there may still be unmeasured confounding factors that could influence the observed associations. Future research should include a broader range of variables to account for potential confounders.
- Lack of Anthropometric and Biological Measurements: The study did not include anthropometric or biological measurements, which could provide more objective assessments of health outcomes. Future studies should consider including these measurements to enhance the accuracy of health assessments.
In view of the above, we would recommend the following:
- Gender-sensitive environmental health policies are needed to address gender role-related risks and to promote women’s health. Moreover, women’s empowerment and investment in safe WASH and cleaner cooking fuels are recommended to foster public health and gender equality.
- Our study indicated improved access to clean fuel and safe WASH throughout the life course.
- Additional studies on armed forces occupational health in Africa are also needed to provide more data on specific populations.
- Establishing sustainable systems that produce high-quality water from source to sip should be the object of an analysis for technical, economic, and health impacts.
- Increasing access to the electricity grid and the use of sustainable energy sources for lighting, such as solar panels, is recommended, especially for the most vulnerable households.
- Moreover, improving access to quality sanitation services is key to a vision of leaving no one behind.
- Increased disaster preparedness, including integrating innovative methods, such as Artificial Intelligence (AI), into emergency systems for more accurate predictions, is also needed.
CONCLUSION
Our study assessed the prevalence of illness among households in Rwanda and the associated sociodemographic and environmental factors to guide policymaking and mitigate key environmental risks to improve the health of the population in Rwanda.
Nearly one-third (32.5%) of participants reported at least one episode of sickness during the past month. The odds of being sick were higher among women, participants older than 15, and subjects affiliated with military health insurance. Similarly, limited access to clean water, the use of firewood or batteries for lighting, unimproved sanitation facilities, and the occurrence of an environmental shock during the past twelve months were associated with higher odds of disease.
Our findings highlight the critical need to foster access to improved water sources, including remote and hard-to-reach areas. Access to clean energy for cooking and lighting remains essential. Further, high-level sanitation services are required to improve the overall health of the population, with a focus on the poorest and most vulnerable. These efforts should particularly target women and older adults, who are disproportionately affected by adverse health outcomes, including gender-sensitive environmental health policies, women’s empowerment, and improved access to clean fuel and safe WASH throughout the life course. Disaster preparedness should also be reinforced, including integrating Artificial Intelligence (AI) into existing emergency systems for more accurate predictions. Longitudinal studies assessing the impact of environmental determinants of health on health using biological measurements, environmental studies on occupational health among the armed forces, and economic analyses of systems producing quality water from source to sip are also needed.
AUTHORS’ CONTRIBUTIONS
The authors confirm their contribution to the paper as follows: D.M., J.C.N., T.N.: Analysis and interpretation of results: C.T.N., C.N., B.C.: Draft manuscript. All authors reviewed the results and approved the final version of the manuscript.
LIST OF ABBREVIATIONS
| AI | = Artificial Intelligence |
| CAPI | = Computer-assisted Personal Interviews |
| CBHI | = Community-based Health Insurance |
| EICV | = Integrated Household Living Conditions Survey |
| GDP | = Gross Domestic Product |
| MMI | = Military Medical Insurance |
| NISR | = National Institute of Statistics of Rwanda |
| RAMA | = Rwanda Medical Insurance |
| WASH | = Water, Sanitation, and Hygiene |
| WHO | = World Health Organization |
ETHICS APPROVAL AND CONSENT TO PARTICIPATE
No ethical approval was required due to the nature of this secondary analysis of EICV 5 data using an anonymized dataset.
HUMAN AND ANIMAL RIGHTS
All procedures performed in studies involving human participants were in accordance with the ethical standards of institutional and/or research committee and with the 1975 Declaration of Helsinki, as revised in 2013.
CONSENT FOR PUBLICATION
Verbal consent was obtained from the head of each household by the data collector the day before the interview during the primary data collection. The anonymized dataset used for our secondary analysis was requested from the National Institute of Statistics of Rwanda (NISR) via an online questionnaire.
AVAILABILITY OF DATA AND MATERIAL
The data supporting the findings of the article is available in the Central Data Catalog at: https://microdata.statistics.gov.rw/index.php/catalog/82/studydescription#page=sampling&tab=study-desc
ACKNOWLEDGEMENTS
Declared none.

