All published articles of this journal are available on ScienceDirect.

Plastic Pollution in Wadis: Investigation at a Hotspot in Wadi Hoqain, Oman
Abstract
Introduction
Plastic pollution is now recognized as a global problem that must also be addressed at the local level. It is important to study not only the marine environment as the final sink but also the sources and pathways within the terrestrial environment. This report presents field investigations on macroplastics conducted in Wadi Hoqain, Oman. While the transport of plastics in perennial rivers has been extensively studied, there remains a lack of knowledge regarding the migration of plastics in ephemeral streams.
Methods
A popular tourist hotspot was chosen as the study site, where macroplastics were collected, classified, and counted at several downstream locations. An app was used to store data directly online during the fieldwork.
Results
Plastic caps and lids were the most frequently found items, followed by plastic food wrappers. The major categories showed a decreasing number of items per area in the downstream direction.
Discussion
The presented findings are examined in the context of the concept of transient storage zones, originally developed for perennial streams. This study demonstrates that the concept can be effectively adapted to explain the unique characteristics of plastic migration in wadis.
Conclusion
The results of our investigations downstream from the hotspot offer insights into the transport of plastic items along the flow path, which may be relevant to ephemeral streams more broadly.
1. INTRODUCTION
1.1. General
Plastic pollution is recognized as a global problem. In 2022, Heads of State, Ministers of Environment, and other representatives from UN Member States endorsed a historic resolution at the UN Environment Assembly (UNEA-5) in Nairobi to end plastic pollution (CIEL, 2025). A total of 175 nations agreed to develop a legally binding agreement on plastic pollution by 2024. This agreement is currently still under discussion (Global Plastic Treaty, 2024).
Since its inception in the 1950s, global plastic production has increased exponentially, along with plastic pollution (Geyer et al., 2017), currently peaking at more than 400 million tons per year (Kubikova and Rudy, 2024). As a product with numerous convenient properties, plastic is produced and consumed in ever-increasing amounts, not only in industry and households, but also in the construction, transportation, and packaging sectors. However, its persistence in natural environments poses a significant problem, as plastic hardly degrades once it enters these ecosystems.
The abundance of plastic in the environment is widely recognized as a serious problem for ecological systems and human health. Plastic pollution not only destroys the natural beauty of terrestrial and aquatic environments but also poses a threat to native fauna and flora. Micro- and nanoplastics enter the food chain and consequently reach humans. In a recent review, Li et al. (2023) described the potential health impacts of microplastics, their environmental distribution, human exposure, and toxic effects. Khan et al. (2024), focusing on the pathway from fish to humans, highlighted the risks microplastic pollution poses to both fish and human health. Ullah et al. (2023) provided evidence of endocrine-disrupting effects in mammals.
Plastic pollution occurs when plastic waste is mismanaged, that is, not recycled, incinerated, or securely stored in sealed landfills. Geyer et al. (2017) estimate that, of all plastic ever produced, 30% is still in use, 12% has been incinerated, and only 9% recycled. More than half of all plastics produced to date have been discarded, accumulating in landfills or the natural environment. For 2019, Ritchie (2023) estimates that 22% of all plastics were mismanaged, including materials burned in open pits, dumped into seas or open waters, or disposed of in unsanitary landfills and dumpsites.
Studies on plastics in the environment currently attract significant attention, not only in political debates, the press, and among the public, but also within the scientific community (He et al., 2020). Research on marine ecology outnumbers studies on terrestrial systems by more than two to one. Furthermore, most studies focus on moderate or wet climates, with very few addressing the unique conditions of arid and semi-arid regions. Regarding Oman and the Oman Sea, only a limited number of publications explore various aspects of plastic pollution. In the Gulf of Oman, Khordagui and Abu-Hilal (1994) identified the potential threat of plastic pollution to the local ecology. Aliabad et al. (2019) highlighted a ‘pressing need to investigate the distribution of microplastics in sediments and biota as well as their effects on marine life and human health,’ a concern reaffirmed more recently by Kor et al. (2020). Additionally, in the mountainous region of Jebel Akhdar, Oman, Al-Mahrouqi and Victor (2017) found plastics to be the largest waste category.
To the best of the authors’ knowledge, no study on plastics in wadis has been published to date. With our work and tremendous support from the students of our university, we aim to fill this gap. A manuscript presenting our findings on plastics and microplastics on Omani beaches is currently in preparation (Ajaj et al., 2025). The primary focus here is on macroplastics in Omani wadis. While we have examined several wadis, including Al-Khoud and Shab, field excursions to Wadi Hoqain yielded the most interesting results. First, we describe the methods used in our field studies, followed by a presentation of the key findings.
1.2. Plastic Waste in Oman
There are no direct data on the amount of plastic waste in Oman; however, estimates can be made based on total waste generation and the proportion of plastic content. According to Al-Harthi (2015), Oman generated 1,190 kilotonnes (kt) of solid waste in 2010. Be’ah, the Oman Holding Company for Environmental Services, is a government-owned entity responsible for implementing waste management policy and effectively holds a nationwide monopoly in this sector. In its 2022 annual report, Be’ah reported waste collected through service providers at 1,432 kt in 2021 and 1,591 kt in 2022, alongside 478 kt in 2021 and 491 kt in 2022 collected from government entities and private compounds (Be’ah, 2022). This amounts to a total of 1,910 kt in 2021 and 2,002 kt in 2022, aligning with the approximately 2 million tonnes of municipal waste stated on Be’ah’s website (Be’ah, 2024). According to the same source, an additional 1.5 million tonnes of industrial waste should be included in the total estimate, while medical waste, at around 4.5 kt per year, contributes only marginally.
Be’ah reports that plastic accounts for 21% of the total waste (Be’ah, 2020). In a study of Al Jebel Al Akhdar, Al-Mahrouqi and Victor (2017) found plastic percentages of 26.7% for municipal waste, 30.4% for military waste, and 15.3% for waste from private companies. The authors note that the municipal figure ‘is not significantly different from the percentage (24.3%) reported by a landfill operator.’ For 2013, Al-Harthi (2015) reported a 32% share of plastic in the total solid waste collected by Be’ah. Assuming a 21% plastic share of the total waste, estimated at 3,500 kt per year, results in approximately 730 kt per year of managed plastic waste across Oman.
2. METHODS
2.1. Hydrological Situation
For the field investigation, the waterfall within Wadi Hoqain was selected (GPS coordinates: 23.55000291, 57.34695567) (Fig. 1a-c). This waterfall is a popular local tourist destination in Oman, accessible from the capital, Muscat, in less than an hour by car. Due to visitors frequently leaving their garbage behind, the site has become a hotspot for waste pollution (Fig. 2a, b).
Within Oman, Wadi Hoqain is relatively favorable in terms of stream discharge, as the waterfall never completely dries up. However, in most years, discharge varies widely, from a mere trickle to a flood. Unfortunately, no hydrograph is available, nor is there a meteorological station at the site. The closest station is in the nearby regional town of Rustaq, where meteorological data are collected. The 12-year average there indicates 25 rainy days per year, irregularly distributed, with a maximum of 5 rainy days in April and a minimum of zero in September. The mean monthly precipitation is 18 mm, which is relatively high for Oman. Monthly rainfall peaks in April with an average of 41.9 mm (Worldweatheronline, 2024). Analysis of quarterly rainfall data from 2009 to 2024 shows a recurrence interval of 8 months for above-average rainfall events, while the recurrence interval for monthly rainfall exceeding 34 mm is approximately 2 years.
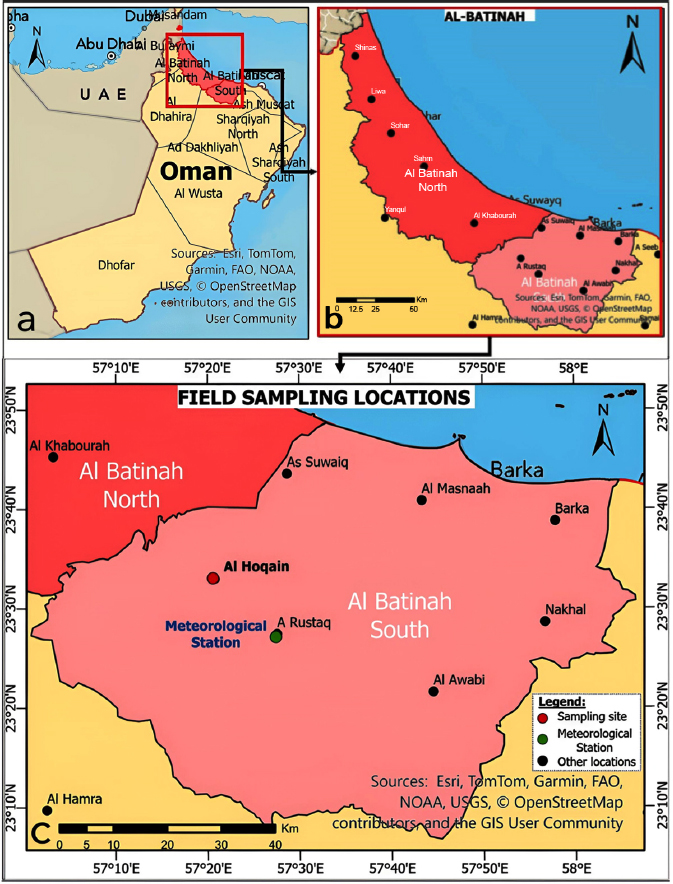
Geographic location, Oman (a), governate of Al-Batinah (b), South Batinah (c), with locations of the main sampling site, Al-Hoquain, meteorological station, and others
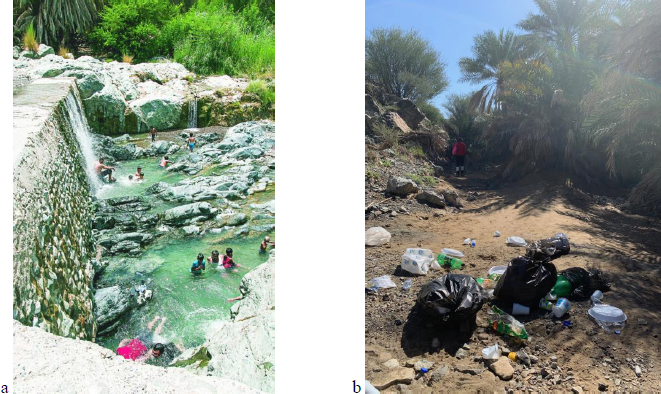
(a) Hoqain waterfall (b) garbage left behind.
2.2. Field Campaigns
Two field trips to the selected location were conducted on February 27th and March 4th, 2023. During the period from January to March that year, only four days recorded rainfall, totaling 4.26 mm (Worldweatheronline, 2024). Consequently, no significant discharge events occurred, as illustrated in Fig. (2). Since a few garbage items had been washed away for over two months, accumulated pollution was clearly visible. Visual inspection identified the waterfall area as a major hotspot for garbage dumping. It was also evident that less plastic originated from upstream of the site. Downstream from this hotspot, 11 sampling sites were selected along the wadi. At each site, a designated area was marked where all macroplastics were collected, separated, classified, and counted (Fig. 3a and b).
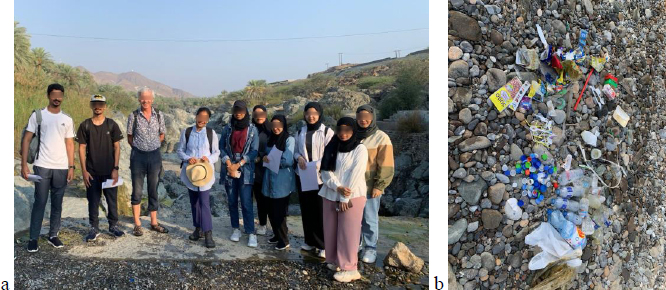
The field trip team and (a) macro-plastics item, (b) collected and separated for classification and counting .
Research on plastics classifies objects based on size: items smaller than 5 mm are termed microplastics, while larger items are classified as macroplastics. Mismanaged primary microplastics enter the environment directly after use, whereas secondary microplastics result from the degradation of macroplastics through mechanical, chemical, biochemical, thermal processes, or photodegradation caused by sunlight exposure. This study focuses specifically on macroplastics.
We used the National Geographic-supported Marine Debris Tracker app (2024) to simplify and expedite our data collection. The app can be downloaded and used directly on a mobile device in the field. It offers a straightforward interface for tracking trash and gathering information on inland and marine debris. Each location’s geographic coordinates are recorded along with data on plastic items sorted into predefined categories. Photos taken during debris collection can also be uploaded. Completed sessions are saved and accessible on the app’s main page for future reference. This app is a highly convenient tool for citizen-based litter and marine debris data collection and mapping (Jambeck and Johnson, 2015). We effectively used it to store all relevant site data in a database directly from mobile devices during our field campaign. However, the app does not categorize plastics by chemical type (e.g., PE, PP, PVC, PS), which are more commonly referenced in scientific literature, especially laboratory studies.
The photos in Fig. (4a-c) provide an impression of waste storage in some downstream locations encountered during the field campaign. The photos not only show the state of the plastic items but also their accumulation at these places. It is mainly quiet bays outside of the main flow where plastic waste becomes trapped for a certain time until the next larger flood event.
3. RESULTS
3.1. Total Occurrence of Macroplastic Items
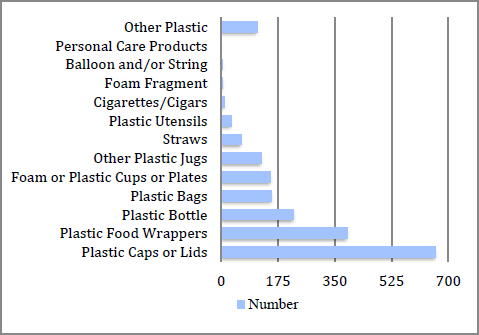
During field trips to Wadi Hoqain, nearly 2,000 items were found across 11 locations. The items were collected and classified (Fig. 5). The category with the highest count was “Plastic Caps and Lids”, with 661 items, followed by “Plastic Food Wrappers”, which totaled 388. More than 100 items were also found in the categories “Plastic Bottles”, “Plastic Bags”, and “Foam or Plastic Cups or Plates.”
Clearly, the list includes common single-use plastic items typically associated with picnics. Notably, the number of plastic caps exceeded the number of plastic bottles. On average, for each bottle collected, approximately three caps were found.
As expected, plastic items found along their downstream path showed various signs of alteration. Some were broken into pieces, others were deformed, discolored, or even degraded. The photos in Fig. (4) provide a visual impression of these changes. Notably, some items remained almost unaltered, this was especially true for plastic caps.
3.2. Downstream Transport
The sampling campaign started at the main tourist hotspot, the waterfall, and continued downstream for roughly 2 km, with 11 sites chosen for sampling along the route. In the following section, we present the occurrences of the categories starting from stop 1 to stop 11. For each site, an area was marked and measured to relate the number of findings to the size of the area. Table 1 shows the results for plastic bottles and caps.
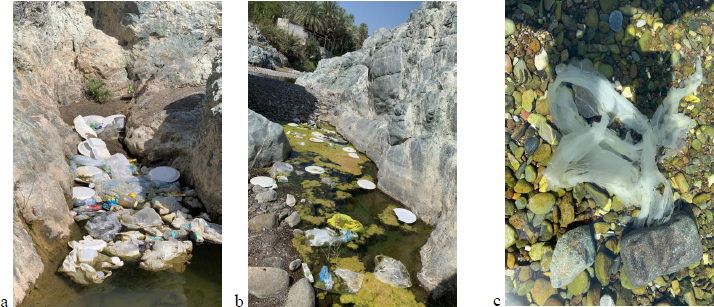
(a, b) Accumulation of plastic waste downstream in storage zones , and (c) a degraded plastic bag at a far downstream stop.
| Stops Number | Plastic Bottles | Caps | Area (m2) | Plastic Bottles | Caps |
|---|---|---|---|---|---|
| 1 | 11 | 61 | 484.8 | 0.022689769 | 0.12582508 |
| 2 | 9 | 10 | 84.28 | 0.106786901 | 0.11865211 |
| 3 | 20 | 15 | 147.8 | 0.135317997 | 0.1014885 |
| 4 | 14 | 35 | 268.6 | 0.052122115 | 0.13030529 |
| 5 | 12 | 26 | 294 | 0.040816327 | 0.08843537 |
| 6 | 17 | 24 | 230.1 | 0.073880921 | 0.10430248 |
| 7 | 51 | 122 | 1232 | 0.041396104 | 0.09902597 |
| 8 | 41 | 98 | 946 | 0.043340381 | 0.10359408 |
| 9 | 2 | 90 | 1408 | 0.001420455 | 0.06392046 |
| 10 | 9 | 34 | 638.6 | 0.014093329 | 0.05324147 |
| 11 | 10 | 25 | 1596 | 0.006265664 | 0.01566416 |
Total number of macro-plastic items found in Wadi Hoquain.
At nearly all stops, more lids were found than bottles with one exception. At the first stop downstream from the waterfall, the number of caps was nearly six times higher than the number of bottles, whereas at the next stop, the two counts were almost equal. A likely explanation for this discrepancy is that the relatively high water velocity at the first location may carry the lighter, floating bottles downstream to the next pool with lower flow rates, while the heavier caps are more prone to becoming trapped between rocks and pebbles.
Fig. (6) visually presents the counts per area from Table 1. The background of the figure is a satellite image from Google Maps. The sizes of the colored disks indicate the quantity of plastic lids (blue) and bottles (light blue) at the exact locations where they were found.
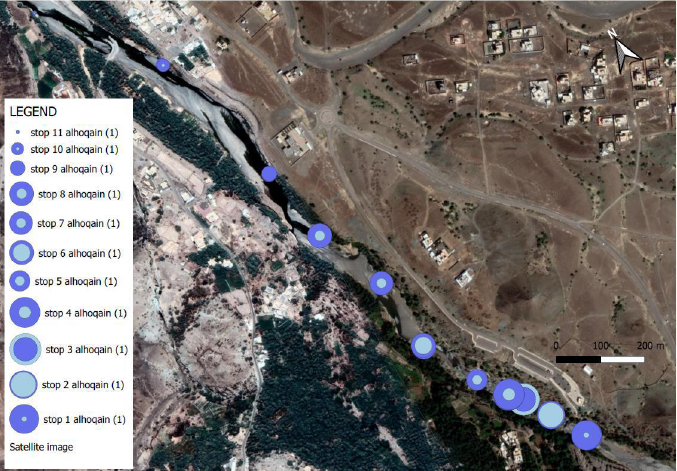
Occurrence of plastic bottles (light blue) and caps (blue) per unit area downstream of the Al Hoqain hotspot (on lower right).
The coloring of the disks shows no constant pattern. The occurrences of plastic items seem to depend on local conditions in the wadi, similar to what was mentioned above for the extreme differences, as seen in the comparison of findings at stops 1 and 2. However, for both caps and bottles, the figure indicates that the number of found items per unit area decreases downstream, which can be termed a dispersion effect. The numerical values depicted in Fig. (7) clearly demonstrate the declining tendency from stop 1, just downstream from the hotspot, to the final stop 11 downstream.
Figs. (6, 8) depicts the occurrences of plastics categorized as ‘Foam, Cups or Plates and Straws’ at the chosen sampling locations. The highest number per area was 15 items per 100 m2 at stop 2, and declined monotonously (with one exception at stop 6), reaching a value one order of magnitude lower at the final stop (Fig. 7).
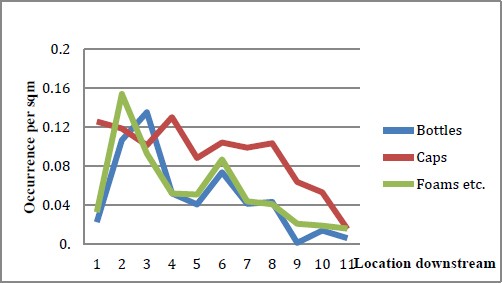
Occurrence of plastic bottles, caps, foams, etc. per area downstream of the hotspot (numbers on x-axis denote stop number).
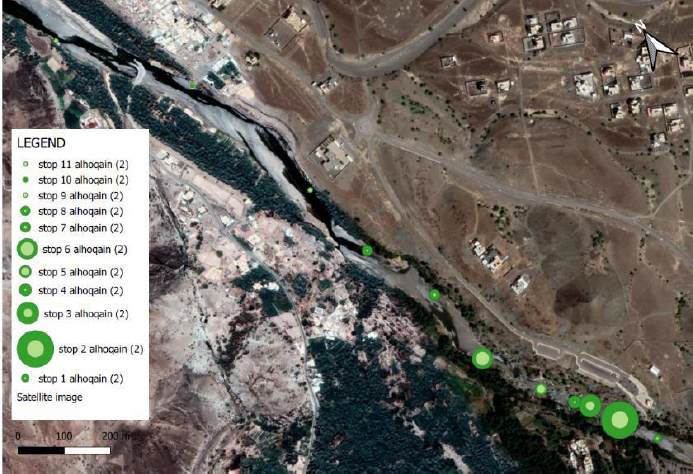
Occurrence of foam, cups, and straws (green) and other plastic items (light green) per unit area downstream of the Al Hoqain hotspot (on lower right).
4. DISCUSSION
Many studies have investigated the migration of plastic items in the environment. Plastic transport in streams represents a significant pathway to the sea, which serves as a major final sink. However, nearly all existing research has focused on perennial streams. This publication aims to address that gap by examining the fate of plastics in an Omani wadi located downstream from a tourist and waste hotspot.
The most frequently found items were plastic caps and lids, followed by plastic food wrappers and plastic bottles. Plastic bags, foam, cups, and straws were also commonly recorded.
The data show a general downstream decline in the number of plastic items per unit area. This trend can be attributed to dispersion and transient storage, a process resembling the movement of particles in streams. As particles move downstream, some become temporarily trapped in storage zones along the edges of the main flow path. The two photos on the left in Fig. (4) clearly depict such transient storage areas.
While the phenomenon of transient storage has been described and analyzed in perennial streams, both in mountainous regions (Kelleher et al., 2013) and in lowlands (Zaramella et al., 2016), it has not been studied in wadis until now.
Models of varying complexity have been developed to describe transport processes in streams. Knapp and Kelleher (2020) provided an overview of the history and future directions of transient storage modeling in stream systems. Most of this modeling work addresses scenarios involving an upstream input in the form of a short- or long-duration pulse.
In contrast, the situation observed in the Omani wadi—where a pollution hotspot is active throughout the year—more closely resembles a continuous or permanent input. For such permanent inputs, modeling studies (e.g., Barati-Moghaddam et al., 2015) have shown the development of a downstream-moving front.
The declining trend in item occurrence per unit area (effectively, a concentration) observed in our field campaign can be attributed to the non-permanent nature of most transient storage zones. These areas are regularly cleared of floating plastic during flood events, which are common in the region. After such a “cleaning” event, a new wave of pollution begins moving downstream, with upstream storage zones becoming filled first, followed progressively by downstream zones. As a result, when measuring concentrations from upstream to downstream, a declining pattern can be expected.
The limited data on macroplastics that we collected during our field campaign suggest that the general features of transient storage zones could be useful in explaining transport in wadis. Following the flow path downstream from the original release, additional storage sites are encountered, where the constituent accumulates only at a later time. This explains the decrease in concentrations downstream. However, the storage is a temporary process, as most of the stored material will be washed away during the next flood event. This indicates that the upstream boundary condition, i.e., the behavior of the source, plays a crucial role in transport in wadis, where short floods are alternated with long periods during which the waterway is almost dry. In our opinion, the findings for a wadi are likely relevant to ephemeral streams in general, and possibly also to perennial streams with frequent flood events.
Notably, the occurrence of plastic caps is three times higher than that of plastic bottles. This is striking at first sight because, at the hotspot itself, the source of pollution, the numbers of both items are likely to be roughly equal. Our observation shows that the transport processes for caps and bottles differ significantly. Flowing water moves plastic bottles more easily, as they are light, floating objects, while caps are more likely to become trapped between stones and pebbles at the bottom or along the sides of the flow path. The aforementioned “cleaning” effect during flood events is less effective for caps, which explains the smaller decline in their concentrations downstream compared to bottles and foam, as shown in Fig. (7).
Several site-specific characteristics of the location surely limit the generalizability of the findings of this study. The high occurrence of food wrappers, for example, stems from the site's popularity for picnics and barbecues. Hotspots of industrial or residential waste dumping would likely change the relative importance of the different plastic categories.
Another relevant issue is the difficulty of selecting sites with similar characteristics along a wadi course for comparison. The water meanders along the wadi, with varying slopes and depths. Significantly different counts can be expected depending on whether a transient storage location is included or not.
The results also depend on the timing of the campaign. The data reported here were collected after a relatively long dry period, during which waste had time to accumulate. If sampling had occurred shortly after a high-discharge event, fewer plastics would likely have been found, making quantitative analysis even more difficult.
CONCLUSION
Based on general observations drawn from extensive discussions with students during and after the campaigns, we conclude that the most effective approach to addressing the problem of plastic pollution, not only in wadis, is raising public awareness. This is supported by an Omani study, which found that environmental awareness is the most significant factor contributing to environmentally friendly behavior (Al-Salmi et al., 2022).
People should be educated about the impacts of plastic pollution, encouraged to avoid single-use plastics, and, if they do use them, reminded to ensure they do not leave them in the environment. At tourist and picnic hotspots on Omani beaches, cleaning teams do an admirable job of collecting garbage regularly. However, this may inadvertently encourage some individuals not only to leave their waste behind but also to increase their consumption of single-use plastic products.
Producers also have a responsibility. More investment is needed in developing plastics that are less persistent in the environment. The ultimate goal should be a circular economy, in which used materials are reintegrated into production through effective recycling systems (Barra and Leonhard, 2018).
Finally, scientists play a crucial role in deepening our understanding of the behavior and environmental threats posed by micro- and macroplastics, as well as exploring viable alternatives in the production, usage, and disposal of plastic materials.
AUTHORS’ CONTRIBUTIONS
The authors confirm their contributions to the paper as follows: E.H.: Study conception and design: Y.A. and J.M.; Data collection:. All authors reviewed the results and approved the final version of the manuscript.
LIST OF ABBREVIATIONS
| GPS | = Global Positioning System |
| PE | = Polyethylene |
| PP | = Polypropylene |
| PS | = Polystyrene |
| PVC | = Polyvinyl chloride |
| UN | = United Nations |
CONSENT FOR PUBLICATION
All participants have given their consent to be shown in the published format.
AVAILABILITY OF DATA AND MATERIAL
All data generated or analyzed during this study are included in this published article.
FUNDING
The presented research was enabled as part of a project funded by The Research Council (TRC) of the Sultanate of Oman under Research Agreement No. BFP/RGP/EBR/21/185.
ACKNOWLEDGEMENTS
The authors are most grateful to the students of the German University of Technology. This work has only been made possible due to the tremendous engagement of the students of the German University of Technology. For this study, special thanks are due to Qabas Al-Dafaie and Ahmed Al-Ismaili.

