All published articles of this journal are available on ScienceDirect.

Temporal Variation in Abundance and Distribution of Butterflies in a Southern Nigerian National Park
Abstract
Aims:
The aim of this study was to determine the butterfly diversity in Okomu National Park, Nigeria in order to make available information on butterfly species in this protected area.
Background:
Butterflies are a taxonomically important group for predicting the health of the environment.
Objective:
In order to establish butterfly abundance and distribution in Okomu National Park, a temporal variation study was conducted for a period of twenty-four months (July 2012 to June 2014).
Methods:
Eight transects (Disturbed habitat (DIS), Forest Edge/Plantation (FE/P), Moderately Open Forest (MOF), Forest Along Road/Moist Patches (FAR/MP), Riparian Habitat (RIP), Closed Canopy (CC), Shrub (SHR) and Grassland (GRA) were mapped out from the four ranges (Igwonwan, Arakhuan, Julius Creek and Babui) using visual level of disturbance and degree of canopy closure for transect walk, butterfly net and baited trap methods of butterfly sampling. Environmental variables (temperature, relative humidity, and rainfall) were concurrently sampled with butterflies.
Results:
A total of 143 species and 6,310 individuals of butterflies were obtained from the families; Nymphalidae, Papilionidae, Pieridae, Lycaenidae, and Hesperiidae. Nymphalid (3103: 49.2%) and Pieridae (2269: 36.0%) predominated and Hesperiidae was recorded lowest (8: 0.1%). Significant differences were observed in the abundance of butterflies in the transects (p< 0.05). Rainfall was positively correlated with butterfly abundance. Butterfly abundance was higher in rainy season compared to dry season except in RIP where a reverse trend was observed. Abundance was higher in FAR/MP (1633: 25.9%) and MOF (1251: 19.8%) compared to other transects, and was lowest in SHR (295: 4.7%).
Conclusion:
It can be concluded that butterflies in Okomu forest is abundant and stable, and as such continuous effort is required to conserve butterfly flora and fauna in this park.
1. INTRODUCTION
Physical variables of the environment, including temperature and precipitation, are a great influence of insect life stages as most rely on the environment for body function. With slight changes in temperature, dramatic changes in the biochemical and metabolic rate of reactions in ectotherms have been reported (Dawson, WR et al, 1992). Thus, growth and developmental rate of insects is dependent on temperature (Buse, A et al., 1999), which predicts their fitness, distribution and migration (Liu, SS et al.,1995) and survival (Taylor, MFJ et al.1998) especially in the tropics. In temperate regions, the life cycle, abundance and distribution of insects are known to also be influenced by rainfall and temperature (Pollard, E et al. 1998 and Sparks, TH et al.1997). Holometabolous insects such as Lepidoptera are very sensitive to changes in humidity, temperature, and light levels, which influence their distribution (Hill JK et al.1995). For instance, in Britain and Finland, the close association between species richness and climatic variables could determine butterfly species ranges and even cause a geographical shifts in abundance (Dennis RHL et al.1993). Increasing temperature in summer within the tolerable level is expected to benefit Lepidoptera populations in a number of ways; such as, increasing flight, mating success and egg laying (Porter, K et al.1992) leading to increased developmental rates, more broods and therefore larger numbers through a multiplier effect (Burke, S et al.2005). However, decreasing temperature in winter is expected to have adverse effects on Lepidoptera, causing disruption in their developmental cycle and diapauses when resources (host plants in suitable condition) are not available, promoting disease and active predation. Though in an exceptional case Increasing and decreasing temperatures in summer and winter respectively did not influence the abundance and distribution of the metalarge white butterflies (Pieris brassicae) in the studies of (Pollard and Roy et al. 2001.)
Rainfall is essential for plant growth particularly butterfly host plants. However, intense and persistent rainfall and cloud can be dangerous to Lepidoptera populations. These effects can cause reduction of flight and nuptial activities such as mating and egg laying and water logging of host plants which would lead to drowning of larvae, triggering diseases, and infections. Beirne et al. provided a clear understanding on the adverse impact of rain on Lepidoptera populations and Malabika et al. indicated that greater numbers of closed canopy forest butterflies are sensitive to changes in rainfall (moisture) availability and humidity. Thus, changes in canopy cover and light penetration have an effect on larval survival, which would have an impact on butterfly abundance and distribution.
Seasonal variations have a great impact on butterfly abundance and distribution. Several studies worldwide have confirmed the impact of temporal variations on the abundance of butterflies with a decline in species observed during the winter or dry season (Kantamaht B, Hammer KC, and Hammer KC, et al 2000). Some other notable studies have equally confirmed rainfall as the most important factor influencing insect abundance and distribution in the tropics, especially butterflies [Kunte K, Kunte K. Yuzhen JIA, Barau K, Tiple AD, Nobre CEB, Arya MK, et al, 1997]. In Nigeria, studies on temporal variation of butterflies are very scanty. Knowledge from this study would provide a better understanding of the ecological and conservation processes in the park that might lead to improved regulation and policy development. Hence, this work is aimed at evaluating the temporal variation in the abundance of butterflies in Okomu National Park, an important National park with unique butterfly species and one of the remaining forests in Southern Nigeria.
2. MATERIALS AND METHODS
2.1. Study Location
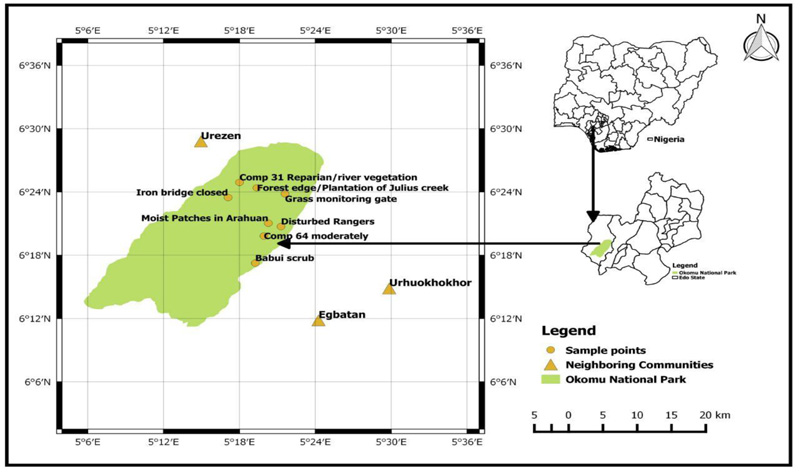
This study was carried out in Okomu National Park, Edo State, Nigeria, one of the parks created and managed by the Nigerian government. Okomu is about 200km2 and located in Ovia South West Local Government Area of Edo State, Southern Nigeria. It lies within Latitude 060 20′ N and Longitude 0.050 16′ E (Fig. 1). The Park is drained by the Osse River, which is located at the eastern boundary and the Okomu River, from which the name of the park was derived and located at the western boundary. The land area covered by the Park makes it the smallest of the seven (7) National Parks in Nigeria (NNPS, Ojianwuna CC).
2.2. Climate
The climate of Okomu National Park and environs is relatively stable. Typically, the southern region has an important feature of the humid tropical wet and dry climate governed primarily by rainfall, which occurs between February and October, with the highest occurring in June, July, August, and September. The driest period is December, January, and March. Annually, temperature in Nigeria range between 11oC and 38oC (mean of 27.2oC) and precipitation range between 2mm and 240mm (mean of 1162.5mm) (NNPS).
2.3. Sampling
Based on the visual level of disturbance and the degree of canopy closure that was adopted from Barau et al.,the ranges were categorised into:
1. Scattered/Open forest (SOF) which indicated features of selective logging in disturbed forests and agricultural activities (plantation).
2. Closed Forest (CF) which showed moderately disturbed forests, trees in closed canopies, and thick vegetation.
3. Swamp Forest (SF), which showed moist patches along road and riparian habitats
4. Shrub (S) which showed grasses and herbaceous plants (Shrubs).
The straight line transect method was used where eight (8) transects were selected in the range of features based on the works of Barau et al. and [Ojianwuna and Akpan ]thus;
(1) T1(Disturbed forest at Compartment 54 Arakhuan (DIS) was at Latitude 060 20′ 43″N, Longitude 0.0050 21′ 17″ E and 62m above sea level
(2) T2 (Forest Edge/Plantation Compartment 29 Julius Creek (FE/P) was at Latitude 060 24′ 23″ N, Longitude 0.050 19′ 23″ E and 82m above sea level for SOF,
(3) T3 (Moderately Disturbed habitat at Compartment 64 Arakhuan (MOF) was at Latitude 060 24′ 54″ N, Longitude 0.0050 19′ 56″ E o AND 64 m above sea level
(4) T4 (Closed Forest at Julius Creek Compartment 30 (CC) was at Latitude 060 23′ 28″N, Longitude 0.0050 17′ 06″ E and 39m above sea level for CF.
(5) T5 (Moist Patches on Road at compartment 54, Arakhuan (FAR/MP) was at Latitude 060 21′ 02″ N, Longitude 0.0050 20′ 27″ E and 53m above sea level
(6) T6 (Riparian Habitat at Compartment 31, Julius Creek (RIP) was at Latitude 060 24′ 54″N, 0.0050 18′ 00″ E and 10m above sea level for SF.
(7) T7 (Shrub at Compartment 89, Babui Range (SHR) was at Latitude 060 17′ 15″N, Longitude 0.0050 21′ 36″E and 40m above sea level
(8) T8 (Grassland at compartment 28, Igwonwan Range (GRA) was at Latitude 060 23′ 49″N, Longitude 0.0050 21′ 36″E and 82m above sea level at S.
Two observers walked the transect for 30mins, counting and obtaining a butterfly specimens.
Butterfly sampling was done between 9.00 am in the morning and 3.00pm in the afternoon when the activities of butterflies were high due to suitable sunny weather conditions. Butterflies were collected differently from the four ranges including Scattered/Open forest (SOF), Closed Forest (CF), Swamp Forest (SF), and Shrub (S). A total of 4 days was devoted for sampling in each month for 24 months (July 2012 to June 2014) under similar sampling techniques. Collection of butterflies was done twice in a month for two years using the Butterfly Trap Technique (BTT) [Venters, N.] and Butterfly Net Technique in the Transect (BNT) [Walepole MJ]. The butterfly trap technique was a passive method for butterfly collection while the butterfly net technique served as an active method. The cylindrical-like trap was made of green coloured net which was closed top and bottom with cylindrical ply board. The trap measured 500 cm length by 200 cm diameter of ply wood. The bottom ply wood of the trap had an opening size, enough to occupy the green bowl containing a mixture of banana and yeast which served as butterfly bait, and a slight opening to allow butterflies’ access to baits. These traps were strategically positioned under trees within the transect. Butterfly nets were used for active collection within transect. This was done at the beginning and end of the month for each sampled months to determine the richness and abundance of species or individuals. Butterfly net was used to catch butterflies in flight and was added to the associating transect. These methods were adopted from Fitzherbert et al. and Aduse-Poku et al. .All data from different days of sampling in each transect were pooled to give data for a month and were expressed as the number of species or individuals per trap /month. Butterflies were taken to the laboratory of Ambrose Alli University for identification using standard taxonomic keys by (Larsen).
2.4. Measurement of Physical Factors
Physical factors such as temperature, humidity, and rainfall were measured using the methods of [Brooks & Kyker-Snowman], with slight modifications. Randomness of sampling for physical variables within each transect was achieved by sampling from any point within (either sides or central point) the transect. RH/Temperature Data Logger (Lascor-EL-USB-2) was programmed to record the temperature and relative humidity on each forest floor transect. Three data loggers were installed in each of the transects before noon on the first day and later removed after three days. By removing and installing the units on consecutive days, all transects were sampled thrice. Rainfall was measured using the rain gauge Monsun radio-controlled rain gauge. This was placed 30m from the forest edge in an open forest about 50m to 100m wide cleared at the Rangers quarters in Arakhuan.
2.5. Environmental Permit
Environmental permit to use Okomu National Park Forest was obtained from the National Park Service, Abuja.
2.6. Analysis of Data
Physical attributes (Abundance and Distribution) of the transects were compared using the mixed model analysis of variance (ANOVA). Descriptive statistics were used to present temporal variations and variations in the taxonomic families. Generalized linear model analysis was done using the butterflies sampled from the different transects for the 24 months to ascertain R2 and differences set at α= 0.05. Alpha diversity analysis was done and the magnitude of change between the transects seasons was compared. Shannon_H index, eveness, and Simpson_1-D index was used to determine species richness and abundance. All analysis was done using Graph Pad Prism and XL STAT (2021 Version).
3. RESULTS
3.1. Temporal Variations in Butterfly Abundance and Distribution
The overall individuals of butterflies obtained from July 2012 to June 2014 in Okomu National Park, Edo State, are summarized in Table 1. A total of six thousand three hundred and ten individuals (6310) and 143 species were captured in Okomu National Park. According to decreasing abundance of butterfly family, Nymphalidae (3103: 49.2%), Pieridae (2269: 36.0%), Papilionidae (554: 8.8%), Lycaenidae (376: 6.0%) and Hesperiidae (8: 0.1%) dominated the sampled transects.
The summary of the generalized linear models of butterflies in various microhabitats in Okomu National Park, Edo State, Nigeria, is shown in Table 2. It showed that butterflies in the various microhabitats followed Poisson distribution except in RIP. Significant difference were observed in the butterflies in the various sampled transects (p<0.0001). Furthermore, the abundance and diversity index of butterflies by season in Okomu National Park, Edo State, Nigeria, is shown in Table 3. Of the 143 species sampled from the transects, higher species abundance was recorded in the wet season than the dry season. Similar trend was observed in the evenness, Shannon diversity, and Simpson dominance. There was a significant difference in the abundance of butterflies in the wet months (April-October) compared to the dry months (November- March) (P<0.05).
| S/N | FAMILY/SPECIES | JULY-SEPTEMBER, 2012 | OCTOBER –DECEMBER, 2012 | JANUARY – MARCH, 2013 | APRIL-JUNE, 2013 | JULY-SEPTEMBER, 2013 | OCTOBER –DECEMBER, 2013 | JANUARY –MARCH, 2014 | APRIL-JUNE, 2014 |
| PAPILIONIDAE | |||||||||
| 1 | Papilio chrapkowskoides nurettini | 19 | 14 | 10 | 8 | 11 | 8 | 5 | 8 |
| 2 | Papilio menestheus menestheus | 11 | 10 | 10 | 7 | 10 | 6 | 2 | 2 |
| 3 | Papilio demodocus demodocus | 8 | 5 | 3 | 1 | 4 | 3 | 1 | 5 |
| 4 | Papilio sosia sosia | 2 | 0 | 1 | 2 | 1 | 1 | 1 | 0 |
| 5 | Papilio nireus nireus | 2 | 0 | 0 | 1 | 2 | 2 | 0 | 0 |
| 6 | Papilio danaus | 5 | 8 | 1 | 1 | 2 | 4 | 2 | 1 |
| 7 | Papilio gallienus | 1 | 0 | 0 | 0 | 1 | 0 | 0 | 0 |
| 8 | Papilio cyproeophilia cyproeofilia | 15 | 13 | 16 | 3 | 8 | 4 | 8 | 4 |
| 9 | Graphium policenes | 58 | 37 | 23 | 12 | 16 | 15 | 21 | 15 |
| 10 | Graphium leonidas leonidas | 7 | 9 | 7 | 7 | 1 | 6 | 6 | 3 |
| 11 | Graphium antheus | 6 | 2 | 5 | 0 | 2 | 0 | 8 | 1 |
| 12 | Graphium angolanus | 0 | 0 | 0 | 0 | 2 | 1 | 0 | 0 |
| PIERIDAE | |||||||||
| 13 | Catopsilia florella | 14 | 7 | 2 | 33 | 11 | 4 | 4 | 28 |
| 14 | Eurema senegalensis | 11 | 4 | 3 | 13 | 10 | 6 | 3 | 14 |
| 15 | Eurema hecabe solifera | 35 | 10 | 6 | 46 | 33 | 17 | 12 | 26 |
| 16 | Eurema brigitta brigitta | 15 | 6 | 6 | 13 | 9 | 5 | 3 | 12 |
| 17 | Eurema floricola leonis | 2 | 3 | 0 | 4 | 3 | 0 | 0 | 2 |
| 18 | Eurema jestardinsii regularis | 8 | 10 | 10 | 8 | 11 | 8 | 9 | 11 |
| 19 | Npheronia argia argia | 6 | 2 | 0 | 15 | 7 | 2 | 0 | 11 |
| 20 | Nepheronia thalassina thalassina | 19 | 6 | 3 | 31 | 15 | 4 | 4 | 20 |
| 21 | Nepheronia pharis pharis | 4 | 2 | 0 | 7 | 6 | 1 | 2 | 8 |
| 22 | Belenois creona creona | 2 | 20 | 13 | 2 | 1 | 15 | 17 | 4 |
| 23 | Belenois calypso calypso | 60 | 250 | 40 | 60 | 25 | 120 | 45 | 90 |
| 24 | Belenois theora theora | 30 | 145 | 50 | 19 | 9 | 69 | 55 | 13 |
| 25 | Appias sylvia sylvia | 21 | 0 | 0 | 26 | 19 | 0 | 0 | 20 |
| 26 | Appias sabina sabina | 3 | 3 | 1 | 4 | 2 | 7 | 3 | 1 |
| 27 | Appias epaphia epaphia | 0 | 8 | 11 | 0 | 0 | 7 | 7 | 0 |
| 28 | Appias phaola phaola | 5 | 2 | 2 | 9 | 4 | 1 | 0 | 5 |
| 29 | Mylothris chloris chloris | 7 | 5 | 8 | 21 | 11 | 4 | 3 | 4 |
| 30 | Mylothris sjoestedti sjoestedti | 2 | 0 | 0 | 3 | 0 | 0 | 0 | 0 |
| 31 | Mylorithris rhodope | 10 | 0 | 0 | 16 | 17 | 2 | 1 | 9 |
| 32 | Leptosia hybrid hybria | 12 | 2 | 1 | 17 | 13 | 1 | 1 | 7 |
| 33 | Leptosia medusa | 11 | 3 | 3 | 13 | 9 | 5 | 5 | 5 |
| 34 | Leptosia marginea | 8 | 1 | 3 | 9 | 6 | 1 | 1 | 2 |
| NYMPHALIDAE | |||||||||
| 35 | Libythea labdaca labdaca | 50 | 20 | 0 | 0 | 220 | 45 | 10 | 0 |
| 36 | Danaus chrysippus chrysipus | 14 | 4 | 2 | 13 | 13 | 6 | 2 | 11 |
| 37 | Amauris niavius niavius | 5 | 1 | 2 | 3 | 5 | 1 | 1 | 2 |
| 38 | Amauris hecate hecate | 0 | 2 | 0 | 0 | 0 | 0 | 0 | 0 |
| 39 | Amauris tart | 4 | 0 | 1 | 6 | 6 | 0 | 1 | 3 |
| 40 | Amauris democles democles | 4 | 1 | 3 | 1 | 2 | 0 | 0 | 0 |
| 41 | Gnophodes chelys | 14 | 7 | 2 | 15 | 25 | 6 | 3 | 8 |
| 42 | Melanitis leda | 8 | 3 | 3 | 6 | 5 | 2 | 0 | 3 |
| 43 | Elymniopsis bammakoo bammakoo | 4 | 1 | 1 | 7 | 5 | 0 | 1 | 4 |
| 44 | Bicyclus xeneas xeneas | 4 | 1 | 0 | 5 | 4 | 3 | 0 | 3 |
| 45 | Bicyclus ephorus ephorus | 7 | 1 | 3 | 10 | 4 | 3 | 2 | 4 |
| 46 | Bicyclus itanus | 4 | 0 | 1 | 4 | 4 | 1 | 0 | 0 |
| 47 | Bicyclus nobilis | 3 | 0 | 1 | 1 | 1 | 0 | 0 | 0 |
| 48 | Bicyclus taenias | 1 | 0 | 0 | 1 | 1 | 0 | 0 | 1 |
| 49 | Bicyclus vulgaris | 4 | 0 | 0 | 9 | 1 | 0 | 0 | 8 |
| 50 | Bicyclus dorothea dorothea | 3 | 2 | 0 | 4 | 3 | 1 | 0 | 2 |
| 51 | Bicyclus sandace | 4 | 2 | 2 | 11 | 4 | 1 | 2 | 10 |
| 52 | Bicyclus auricruda auricruda | 2 | 0 | 0 | 9 | 2 | 0 | 0 | 8 |
| 53 | Bicyclus mandanes | 3 | 5 | 4 | 4 | 5 | 5 | 3 | 4 |
| 54 | Bicyclus sylvicolus | 2 | 3 | 3 | 3 | 2 | 1 | 0 | 3 |
| 55 | Bicyclus funebis | 5 | 11 | 11 | 3 | 1 | 15 | 20 | 2 |
| 56 | Bicyclus martius martius | 3 | 3 | 2 | 4 | 2 | 4 | 0 | 3 |
| 57 | Ypthima doleta | 4 | 7 | 7 | 6 | 6 | 5 | 6 | 6 |
| 58 | Ypthima pupillaris pupillaris | 2 | 1 | 0 | 2 | 1 | 1 | 0 | 3 |
| 59 | Charaxes fulvascens fulvascens | 1 | 1 | 0 | 0 | 3 | 0 | 0 | 2 |
| 60 | Charaxes candiope candiope | 7 | 4 | 2 | 14 | 9 | 6 | 2 | 11 |
| 61 | Charaxes protoclea protoclea | 11 | 6 | 9 | 13 | 7 | 6 | 2 | 8 |
| 62 | Charaxes boueti | 5 | 3 | 2 | 6 | 7 | 2 | 2 | 5 |
| 63 | Charaxes lucretius lucretius | 11 | 3 | 4 | 10 | 10 | 2 | 0 | 10 |
| 64 | Charaxes castor castor | 9 | 2 | 4 | 6 | 7 | 1 | 3 | 9 |
| 65 | Charaxes brutus brutus | 5 | 2 | 0 | 6 | 5 | 1 | 0 | 6 |
| 66 | Charaxes bipunctatus bipunctatus | 2 | 0 | 0 | 5 | 0 | 0 | 0 | 5 |
| 67 | Charaxes numenes numenes | 14 | 4 | 4 | 17 | 12 | 5 | 8 | 17 |
| 68 | Charaxes smagadalis butleri | 6 | 1 | 0 | 5 | 7 | 1 | 0 | 6 |
| 69 | Charaxes tiridates tiridates | 22 | 4 | 0 | 28 | 16 | 2 | 3 | 26 |
| 70 | Charaxes zingha | 7 | 3 | 1 | 7 | 5 | 1 | 2 | 5 |
| 71 | Charaxes eupale eupale | 35 | 23 | 3 | 16 | 41 | 48 | 2 | 21 |
| 72 | Charaxes eupale latimargo | 7 | 4 | 1 | 7 | 15 | 10 | 2 | 8 |
| 73 | Charaxes catachrous | 1 | 1 | 0 | 1 | 1 | 1 | 0 | 0 |
| 74 | Charaxes bocqueti bocqueti | 2 | 1 | 0 | 2 | 2 | 1 | 0 | 3 |
| 75 | Charaxes virilis virilise | 5 | 2 | 1 | 6 | 6 | 2 | 0 | 4 |
| 76 | Charaxes viola viola | 4 | 0 | 0 | 7 | 5 | 0 | 0 | 4 |
| 77 | Charaxes pleione pleione | 5 | 2 | 1 | 7 | 5 | 0 | 1 | 5 |
| 78 | Charaxes doubledayi doubledayi | 1 | 0 | 0 | 2 | 3 | 0 | 0 | 1 |
| 79 | Euxanthe eurinome eurinome | 1 | 0 | 0 | 0 | 3 | 0 | 0 | 2 |
| 80 | Palla violinitens violintens | 4 | 2 | 0 | 4 | 8 | 2 | 1 | 4 |
| 81 | Palla decius | 3 | 0 | 0 | 6 | 6 | 1 | 0 | 4 |
| 82 | Palla ussheri ussheri | 4 | 2 | 1 | 6 | 6 | 0 | 0 | 3 |
| 83 | Palla publius publius | 3 | 2 | 1 | 3 | 2 | 0 | 0 | 3 |
| 84 | Kallmoides rumia rumia | 8 | 3 | 4 | 7 | 6 | 4 | 2 | 6 |
| 85 | Precis pelarga | 19 | 8 | 5 | 9 | 20 | 8 | 6 | 9 |
| 86 | Hypolimnas anthedon anthedon | 2 | 2 | 1 | 4 | 4 | 0 | 2 | 2 |
| 87 | Hypolimnas salmau’s salmau’s | 7 | 3 | 1 | 10 | 6 | 1 | 1 | 7 |
| 88 | Protogonomorpha parhassus | 7 | 6 | 0 | 7 | 12 | 3 | 1 | 6 |
| 89 | Junonia oenone oenone | 7 | 3 | 4 | 6 | 4 | 3 | 3 | 5 |
| 90 | Junonia sophia sophia | 3 | 1 | 1 | 4 | 3 | 1 | 1 | 3 |
| 91 | Junonia stygia | 3 | 1 | 0 | 3 | 2 | 0 | 0 | 3 |
| 92 | Junonia terea terea | 2 | 1 | 0 | 2 | 2 | 0 | 0 | 2 |
| 93 | Cymothoe egesta egesta | 6 | 2 | 1 | 8 | 5 | 1 | 2 | 8 |
| 94 | Cymothoe hypatha okomu | 4 | 1 | 0 | 2 | 1 | 0 | 0 | 3 |
| 95 | Cymothoe egesta confuse | 4 | 0 | 0 | 4 | 1 | 0 | 0 | 5 |
| 96 | Cymothoe hesiodotus nigeriensis | 6 | 1 | 1 | 8 | 4 | 1 | 1 | 11 |
| 97 | Cymothoe judotta judotta | 3 | 0 | 1 | 5 | 3 | 1 | 1 | 6 |
| 98 | Cymothoe coccinata coccinata | 3 | 0 | 0 | 3 | 4 | 0 | 0 | 5 |
| 99 | Pseudacraea boisduvali boisduvali | 4 | 3 | 0 | 3 | 7 | 1 | 2 | 3 |
| 100 | Neptis metella metella | 10 | 7 | 6 | 7 | 8 | 6 | 5 | 9 |
| 101 | Neptis soclava marpessa | 6 | 4 | 0 | 6 | 6 | 4 | 0 | 8 |
| 102 | Neptis serena serena | 10 | 5 | 1 | 9 | 9 | 4 | 2 | 10 |
| 103 | Neptis strigata strigata | 7 | 4 | 0 | 4 | 4 | 1 | 1 | 4 |
| 104 | Catuna oberthueri | 2 | 1 | 0 | 3 | 4 | 1 | 2 | 3 |
| 105 | Euriphene abasa | 3 | 1 | 0 | 1 | 2 | 0 | 0 | 2 |
| 106 | Babearia cocalia continentalis | 5 | 3 | 1 | 4 | 3 | 2 | 0 | 6 |
| 107 | Babearia paludicola | 2 | 2 | 0 | 2 | 3 | 2 | 1 | 2 |
| 108 | Babearia sophus sophus | 5 | 3 | 1 | 7 | 6 | 2 | 4 | 7 |
| 109 | Babearia flaminia | 6 | 3 | 2 | 5 | 6 | 3 | 0 | 4 |
| 110 | Babearia nivaria nivaria | 4 | 1 | 0 | 2 | 4 | 1 | 0 | 3 |
| 111 | Babearia phantasina | 2 | 3 | 0 | 4 | 3 | 1 | 0 | 3 |
| 112 | Babearia laetitia laetitia | 5 | 2 | 1 | 7 | 7 | 1 | 1 | 5 |
| 113 | Eupheadra hebes | 6 | 2 | 3 | 15 | 4 | 1 | 1 | 12 |
| 114 | Eupheadra focura | 4 | 1 | 0 | 3 | 4 | 0 | 0 | 2 |
| 115 | Eupheadra permixtum diva | 2 | 0 | 0 | 1 | 1 | 0 | 1 | 1 |
| 116 | Eupheadra janetta janetta | 8 | 4 | 0 | 7 | 7 | 3 | 2 | 7 |
| 117 | Eupheadra splendens | 3 | 1 | 0 | 5 | 3 | 2 | 0 | 7 |
| 118 | Eupheadra adonina adonina | 3 | 0 | 0 | 4 | 1 | 1 | 0 | 3 |
| 119 | Eupheadra precussiana protea | 1 | 1 | 0 | 1 | 3 | 1 | 0 | 1 |
| 120 | Eupheadra eleus eleus | 2 | 1 | 0 | 1 | 2 | 1 | 0 | 1 |
| 121 | Eupheadra harpalyce harpalyce | 3 | 1 | 0 | 4 | 6 | 1 | 1 | 5 |
| 122 | Acraea jodutta jodutta | 3 | 0 | 0 | 1 | 8 | 1 | 0 | 4 |
| 123 | Acraea lycoa lycoa | 14 | 11 | 0 | 9 | 6 | 8 | 0 | 6 |
| 124 | Acraea serena serena | 7 | 9 | 8 | 9 | 10 | 6 | 4 | 8 |
| 125 | Acraea vestalis vestalis | 4 | 5 | 2 | 4 | 4 | 2 | 1 | 4 |
| 126 | Acraea excisa | 0 | 0 | 0 | 3 | 0 | 0 | 0 | 2 |
| LYCAENIDAE | |||||||||
| 127 | Aslauga vininga vininga | 2 | 0 | 2 | 0 | 0 | 0 | 0 | 0 |
| 128 | Megalopalpus zymna | 2 | 3 | 0 | 0 | 2 | 1 | 0 | 1 |
| 129 | Telipna conjuncta | 3 | 1 | 1 | 0 | 1 | 1 | 1 | 0 |
| 130 | Mimeresia dinora dinora | 0 | 1 | 9 | 0 | 0 | 1 | 7 | 0 |
| 131 | Aethiopana honorius honorius | 0 | 0 | 5 | 0 | 0 | 0 | 2 | 0 |
| 132 | Oxylides faunus faunus | 0 | 0 | 4 | 0 | 2 | 1 | 4 | 0 |
| 133 | Hypolycaena antifaunus antifaunus | 2 | 1 | 2 | 2 | 0 | 2 | 2 | 3 |
| 134 | Paradeudorix ituri ituri | 0 | 0 | 1 | 1 | 0 | 0 | 1 | 0 |
| 135 | Paradeudorix marginata | 0 | 0 | 0 | 0 | 0 | 0 | 2 | 0 |
| 136 | Triclema coerulea | 1 | 0 | 1 | 3 | 0 | 0 | 2 | 3 |
| 137 | Thermoniphas fumosa | 0 | 0 | 0 | 1 | 0 | 0 | 0 | 2 |
| 138 | Oboronia punctatus | 0 | 0 | 1 | 4 | 0 | 0 | 0 | 2 |
| 139 | Azanu mirza | 100 | 0 | 0 | 0 | 100 | 0 | 0 | 0 |
| 140 | Pilodeudorix anetia | 50 | 0 | 0 | 0 | 30 | 0 | 0 | 0 |
| 141 | Abisara tantalus tantalus | 0 | 0 | 4 | 0 | 0 | 0 | 2 | 1 |
| HESPERIIDAE | |||||||||
| 142 | Pterotienom laterculus | 0 | 0 | 0 | 2 | 0 | 0 | 0 | 2 |
| 143 | Coeliades forestan forestan | 0 | 0 | 0 | 2 | 2 | 0 | 0 | 2 |
| Microhabitats | Slope | Intercept | Log likelihood | p-value |
| DIS | 0.66 ± 0.06 | 5.82 ± 1.33 | -21.40 | < 0.0001 |
| FE/P | 1.83 ± 0.12 | 10.07 ± 2.40 | -48.92 | < 0.0001 |
| MOF | 1.28 ± 0.06 | 3.12 ± 2.67 | -66.76 | < 0.0001 |
| FAR/MP | 0.37 ± 0.03 | 8.19 ± 1.93 | -62.24 | < 0.0001 |
| RIP | -0.36 ± 0.05 | 45.33 ± 2.20 | -95.42 | < 0.0001 |
| CC | 0.29 ± 0.05 | 7.18 ± 1.51 | -33.19 | < 0.0001 |
| SHA | 0.18 ± 0.04 | 7.07 ± 1.39 | -23.50 | < 0.0001 |
| GRA | 0.86 ± 0.14 | 5.70 ± 1.79 | -33.65 | < 0.0001 |
| Diversity indices | Wet Season | Cumulative data from the two replicate per month | Dry Season | Cumulative data from the two replicate per month |
| Taxa_S | 138 | (138-138) | 130 | (130-130) |
| Number of Individual | 4059 | (4059-4059) | 2251 | (2251-2251) |
| Shannon_H | 4.354 | (4.306-4.372) | 3.827 | (3.747-3.873) |
| Evenness_e^H/S | 0.564 | (0.537-0.574) | 0.353 | (0.326-0.370) |
| Simpson_D | 0.978 | (0.976-0.979) | 0.940 | (0.933-0.945) |
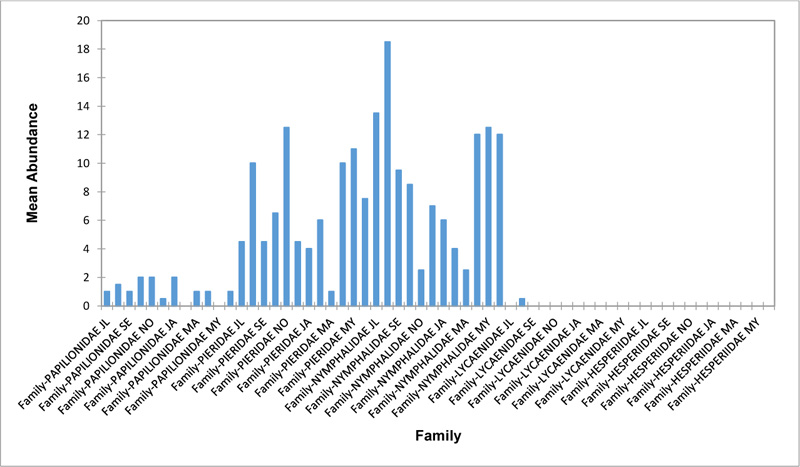
3.2. Relative Abundance of the Taxonomic Families of Butterflies in the Sampled Transects
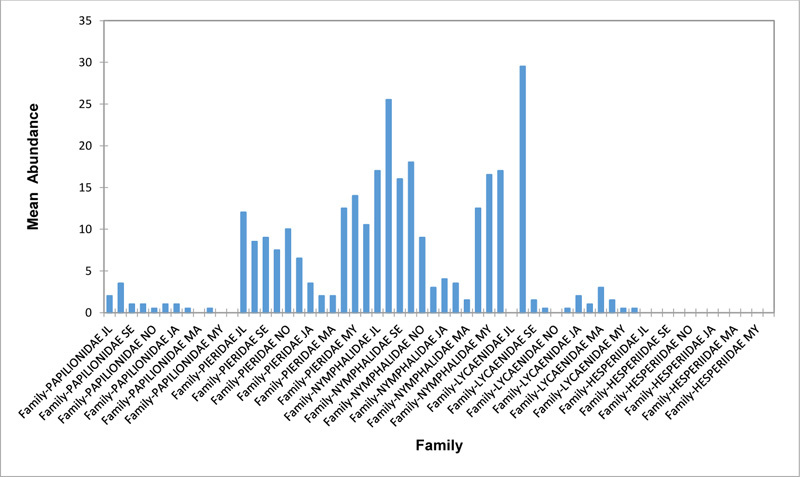
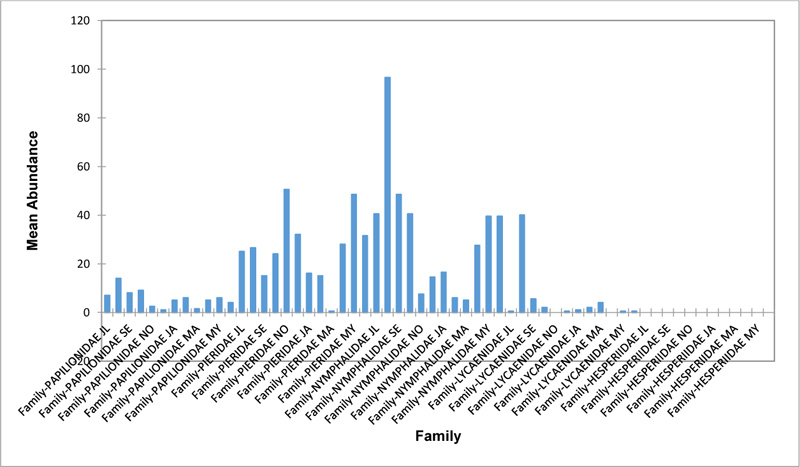
Relative abundance of butterflies between the sampled transects in Okomu National Park, Edo State, Nigeria, were generally significant (F (Transects) = 24.66, P<0.05). However, within the different transects, significant abundances were equally observed. In the disturbed open forest (DIS) (Fig. 2a), Lycaenidae were highest collected mainly in the month August during the break of the raining period. Pieridae and Nymphalidae occurred throughout the months of sampling. The mean abundance of Pieridae and Nymphalidae were higher in July and August respectively when compared to the other months where a decline in the mean abundance was observed. Papilionidae was scarcely recorded while Hesperiidae was completely absent in this habitat. There was a significant difference in the butterflies obtained within sampled months (R2= 0.936; p<0.05).
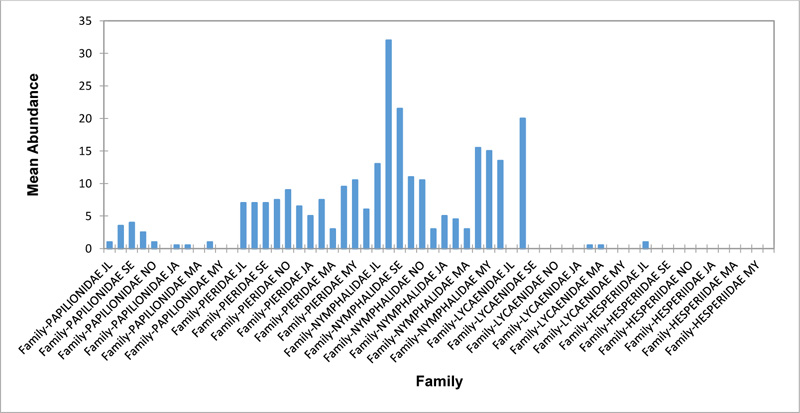
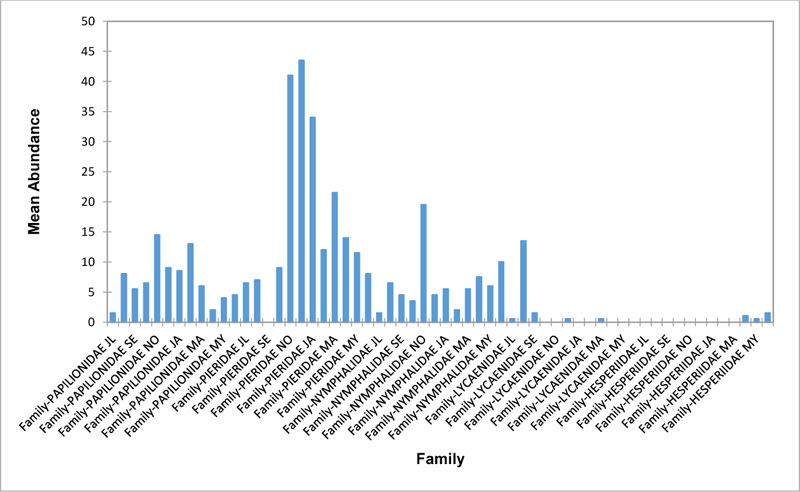
In the forest edge/ plantation (FE/P) (Fig. 2b), individuals of Nymphalidae were collected throughout the year with peaks in August and Lycaenidae followed closely. Pieridae were equally sampled throughout the year and peaked in November. There was a decline in abundance during the dry season. Hesperiidae occurred only in July and Lycaenidae in the moths of July to September. The difference between butterflies obtained within sampled months was significant (R2= 0.928; p<0.05). In the moderately open forest (MOF) (Fig. 2c), all families of butterflies were collected throughout the years of sampling except Hesperidae which was not encountered. Most butterflies were abundant in the wet season and a decline was observed in the dry season. The abundance of Numphalidae in August was the highest and closely followed by their abundance in May. The difference between butterflies obtained within sampled months was significant (R2= 0.432; p<0.05).
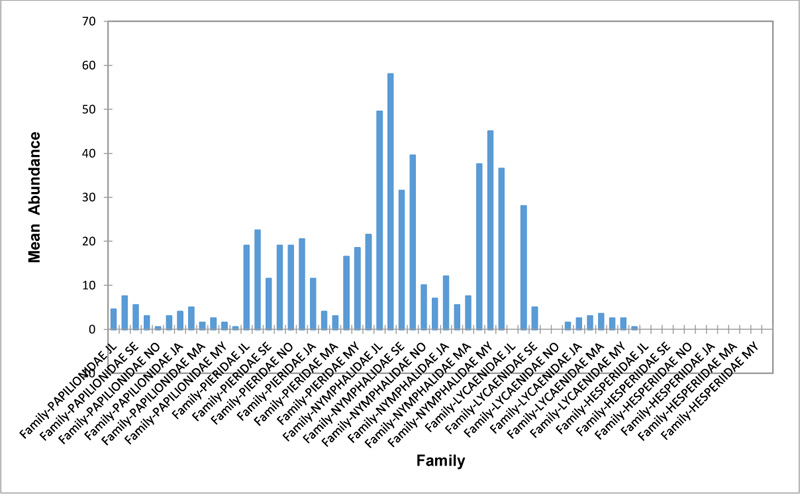
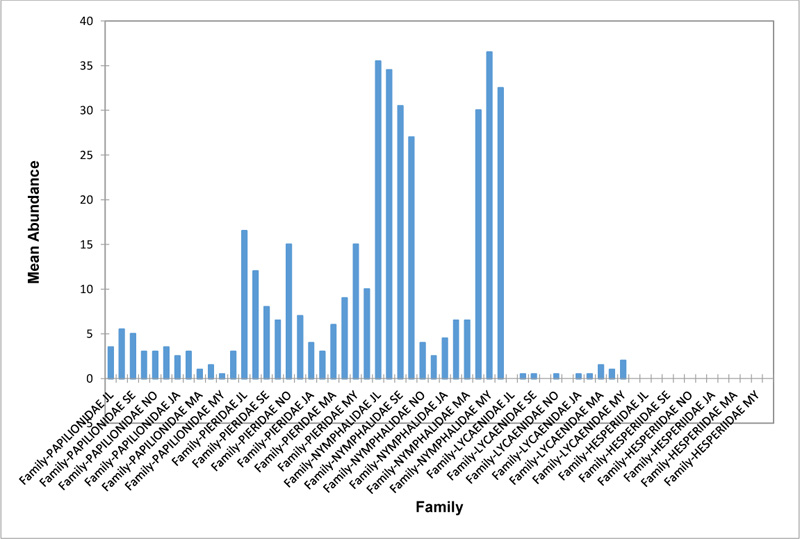
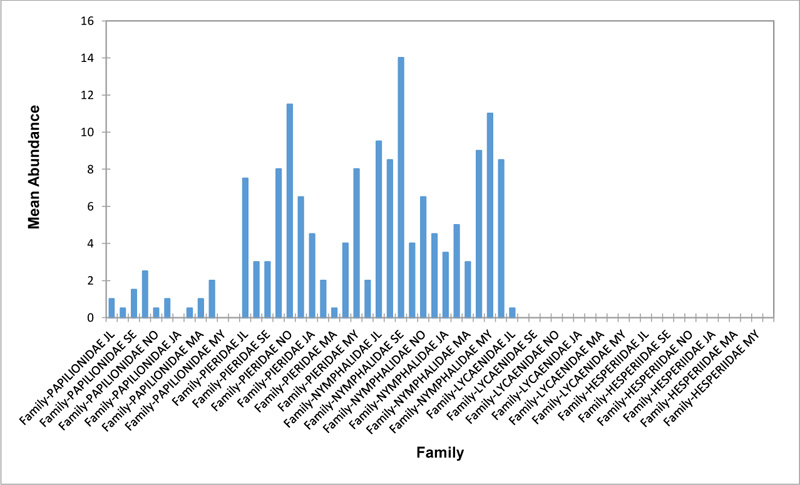
In the Forest along Road with Moist Patches (FAR/MP) (Fig. 2d), Papilionidae, Pieridae, and Nymphalidae occurred throughout the years of sampling. Nymphalidae was highest in August and equally in May and June. Pieridae was highest in November. Abundances of Papilionid and Lycaenid butterflies were high in August. Hesperiidae was absent in this Transect. The differences in abundance between butterfly families were significant (R2= 0.825; p<0.05). The trend in abundance was the reverse in Riparian Forest around Rivers (RIP) (Fig. 2e). Within the butterfly families sampled in this transect, Pieridae was the highest and in December. Papilionidae and Nymphalidae were obtained in the dry season, November precisely. Hesperiidae were collected during the wet season in a very small abundance. Lycaenidae was highly occuring in August. The differences were significant (R2= 0.388; p=0.001).
The Closed Canopy (CC) transect (Fig. 2f) showed high abundance of Nymphalid butterflies in May and August. Although, a decline was observed afterwards. Pieridae in July was high and a rise in abundance was observed in November. Papilioniodae, Pieridae, and Nymphalidae were encountered throughout the sampling period. Papilionidae and Lycaenidae were mainly obtained in the wet season but in low numbers. Hesperiidae was also absent in this transect. The difference was significant (R2= 0.808; p< 0.05). In shrub habitat (SHR) (Fig. 2g), Nymphalidae was highest in September. Pieridae and Nymphalidae were collected throughout the sampling. Apart from Lycaenidae recorded in July, Lycaenidae and Hesperidae were absent in this transect. The difference was significant (R2= 0.707; p<0.05).
In grassland habitat (GRA) (Fig. 2h), the abundance of Nymphalidae was highest in August and was followed closely with their abundance in May. Pieridae was high in November. Pieridae and Nymphalidae were collected throughout the sampled period. Papilionidae occurred in lower numbers which cut across the wet and dry seasons. Hesperiidae and Lycaenidae were completely absent in this transect. The difference was significant (R2= 0.812; p<0.05).
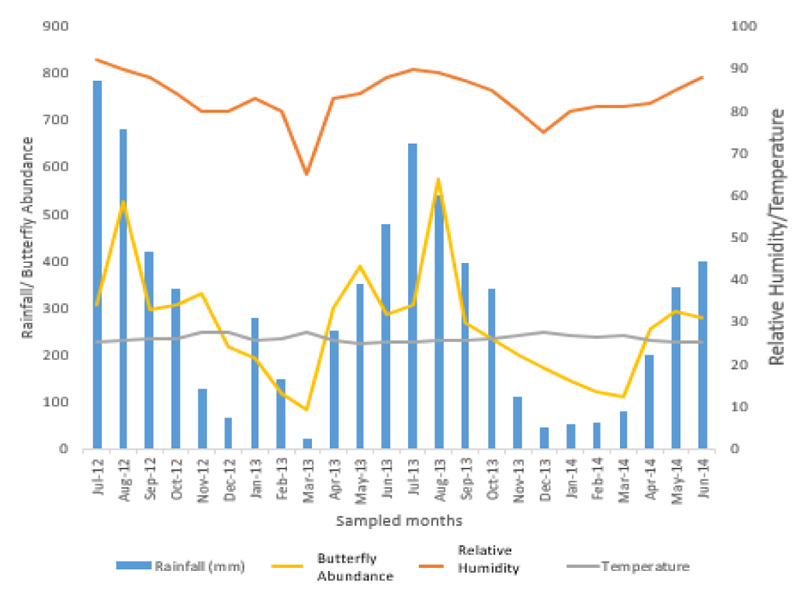
3.3. Relationship Between the Physical Parameters and Butterfly Abundance
The relationship between monthly variations in rainfall, temperature, relative humidity, and butterfly abundance was recorded in Okomu National Park, Edo State, between July 2012 and June 2014 (Fig. 3). Rainfall ranged between 45mm to 785mm. Relative high rainfalls were recorded in the months of June, July, and August. The amount of rainfall reduced greatly in March and low rainfalls were observed in December, January, and February. Rainfall was positively correlated with butterfly abundance throughout the months of sampling (0.924).
The pattern of variation in relative humidity is similar to that of rainfall. It ranged from 65% in March to 90% in July. Being a rainforest and protected area, high percentage saturation was recorded in the months of July to September. March recorded the lowest saturation. Other months also recorded slightly higher relative humidity. Relative humidity was equally positively correlation with butterfly abundance through the sampling months (0.722).
Temperature ranged between 22.0oC and 32.0oC but slightly varied within the months, and there was no significant correlation between mean temperature and relative butterfly abundance throughout the sampling period.
4. DISCUSSION
Environmental factors influence the abundance and distribution of butterflies in tropical and subtropical regions. Rainfall is the most important physical factor directly affecting butterflies in the tropics and several studies have proven this [Kunte K, et al, 2009]. Rainfall is the key driving parameter for butterfly abundance and survival. According to [Ludecke et al. 2021], the main drivers of rainfall in Nigeria are the North Atlantic Oscillation (NAO, March), the Indian Oceanic Dipole (IOD, April and November), Atlantic Multidecadal Oscillation (AMO, June and September) and the Pacific Decadal Oscillation (PDO, September). Other factors such as temperature and moisture gradient have been reported to have indirect effect on butterflies, especially variation in abundance of adults [Barau K 2010, and Wolda H, et al, 1989].Often fluctuations in temperature between wet and dry months are minimal compared to rainfall which shows remarkable gradients. The study revealed that throughout the months of sampling, rainfall positively influenced butterfly abundance. It was observed that as the rains increased during the wet seasons, butterfly abundance in DIS, FE/P, MOF, FAR/MP, CC, SHR and GRA increased. The observation of [Ludecke et al. 2021] on rainfall pattern in months coincides with months with high butterfly abundance. However, a reverse trend of abundance was observed in RIP with low abundance of butterflies in the wet season. During the dry seasons, butterfly abundance was low in DIS, FE/P, MOF, FAR/MP, CC, SHR and GRA while RIP showed high abundance of butterflies. The seasonal trend could be attributed to synchrony with the phenology of food /host plants and less predation during the wet season which ensured the survival of larvae and adult butterflies [Wolda H et al., 1989, Spitzer K et al.]. Moreover, a significant reduction in rainfall that occurred during the dry season may have led to a decline in food availability and increased plant defoliation. Studies have shown that once there is a decrease in food supplies, there is an end to the annual cycle of most butterfly species, some which may migrate to more humid areas, aestivate or enter into diapauses, [Janzen DH et al.,1983, Martins CF et al. 1994]. This may be the reason there was low abundance of butterflies in the dry seasons, especially in the months of March when rainfall was lowest. The overall abundance of butterflies in RIP was highest in the dry seasons of February and March of the sampling period compared to the wet seasons. The presence of the river even in the dry season may be a contributing factor to the abundance of butterflies as they were observed in cluster around wet sands taking water, nutrients, and minerals for survival during the dry periods. They also tend to avoid the environment with extreme heat and seek cooler areas during this period. Studies have shown that riparian forests support more butterflies during dry seasons because of the vegetation around water, mud, wet sand with nutrients, and leaf litter compared to the wet months [Janzer DH et al.,1983, Vu LV et al., 2011].
High rainfalls in the study were obtained in the months of June, July, and August, but the highest abundance of butterflies was in August. The small windows of sunshine (August break) in between showers in August may be a factor responsible for the high abundance of butterflies. [Larsen et al.] explains that butterflies are encountered mainly in suitable sunny weather with adequate rainfall. The high butterfly abundance recorded in the months of June and July, which were the peak of the wet season, were not as high as the butterflies obtained in August. Studies have shown that some adults and larvae of butterflies may be killed or removed and eggs may be dislodged by heavy rainfall causing overflooding of the area. This may depress reproductive activities such as mating and egg laying and cause water logging of host plants. These may have led to the decrease in their numbers in those months of very high rainfall [Hammer KC et al.,2000], [Barau K, et al., 2010 - Arya MK, et al, 2014].
The abundance pattern of families of butterflies with respect to months indicated that Papilionidae and Pieridae species were seen all the year around and was significantly higher in the wet season (April to October) (Figures 2a-d and 2f-h). However, their numbers reduced during the dry season (November to March) when the areas became hot and the individuals searched for cooler areas. There was also a reverse trend of butterfly family abundance in RIP as most families were obtained in the dry season and low in the wet season. There were significant differences in the butterflies sampled in the various transects (p< 0.05). Again, the presence of moisture in RIP may be the reason butterfly families, especially Pieridae, Papilionidae, and Nymphalidae, were obtained during dry season in high numbers. Similar findings from [Nobre et al. 2012] and [Arya et al, 2014] showed high butterfly species in the wet season and significantly low species in the dry season. Papilio species were also observed in all transects. Researches have shown that physical variables like light, humidity can affect the abundance of Papilla species because their flight range gives them the opportunity to visit flowers, open habitats, and forest canopies. This may also be the reason they were seen in all habitats. Butterfly species were higher in the wet season than in the dry as well as the number of individuals, Shannon, evenness, and Simpson dominance index.
Lycaenidae had large numbers of individuals occurring at a particular season (July to September), probably when the host plants were abundant for the caterpillars to grow. [Kunte et al. 2000], [Kunte K et al. 2000] and [Rajagopal et al. 2011] state that the abundance of Lycaenidae at a particular season could be the time when the plants were in a suitable phenophase for the growth of the caterpillar. Hesperiidae were obtained in RIP and FE/P during wet season (April to May) in very low numbers. It may be as a result of their habits and time of sampling, usually found very early in the morning. [Kunte et al. 2000] also reported that they are seen active in early day time under shades of jungle or out in the open during cloudy/wet weather. This may be the reason they were found around RIP and FE/P habitats. Another reason for the low species of Lycaenidae and Hesperiidae may be as a result of their small size which may have restrained dispersal [Lodh JMR et al. 2016].
CONCLUSION
This study also shows that there is a seasonal pattern in the abundance and distribution of butterflies in the park, with rainfall being a major factor affecting this pattern and fluctuation. Butterflies were more abundant in August, and highly recorded in the wet season compared to the dry season. Nymphalidae and Pieridae were seen all year round in large numbers around riversides and water puddles, and lower in the dry season. Hesperidae and Lycaenidae were seasonal butterflies and scarce because of their habits. It can be concluded that butterfly in Okomu forest is abundant and stable, and as such continuous effort is required to conserve butterfly flora and fauna in this park.
ETHICS APPROVAL AND CONSENT TO PARTICIPATE
Not applicable.
HUMAN AND ANIMAL RIGHTS
No animals and human were used for studies that are the basis of this research.
CONSENT FOR PUBLICATION
Not applicable.
AVAILABILITY OF DATA AND MATERIALS
The authors confirm that the data supporting the findings of this study are available within the manuscript.
FUNDING
The study was supported by the Delta State University, Abraka for facilitating the Staff training Tetfund grant (Ph.D) for academic staff studying in Nigeria.
CONFLICT OF INTEREST
The authors declares no potential conflict of interest.
ACKNOWLEDGEMENTS
The authors wish to express special thanks to Okomu National Park service team for assistance during the sampling period. Authors are equally grateful to the Delta State University, Abraka for facilitating the Ph.D. Tetfund grant for academic staff studying in Nigeria.
REFERENCES
[CrossRef Link]
[CrossRef Link]
[CrossRef Link]
[CrossRef Link]
[CrossRef Link]
[CrossRef Link]
[CrossRef Link]
[CrossRef Link]
[CrossRef Link]
[CrossRef Link]
[CrossRef Link]
[CrossRef Link]
[CrossRef Link]
[CrossRef Link]
[CrossRef Link]
[CrossRef Link]
[CrossRef Link] [PubMed Link]
[CrossRef Link]
[CrossRef Link]
[CrossRef Link]
[PubMed Link]

