All published articles of this journal are available on ScienceDirect.

Investigation of Thermal Comfort Changes Using Summer Simmer Index (SSI): A Case Study in Different Climates of Iran
Abstract
Objective:
This study aimed to assess the thermal comfort trend using a metrological parameter based on the Summer Simmer Index (SSI), for different climates of Iran between 1985 and 2014.
Methods:
This is a Time-series study. The new SSI was calculated using metrological data in a 30 year- period for illustrating the changes to the thermal comfort or discomfort level through summer months in different climates of Iran. Mann- Kendall test and Sen's Slope were used to compare the upward or downward trend of the index during this period.
Results:
The worst thermal condition was observed in the southern and central regions of the country. A few stations were put in comfort zone (77≤SSI<83°F). The fluctuations of SSI were not considerable during the study period (P<0.001). However, a commonly upward trend was observed, indicating rising temperature. This initial assessment, which can be reported daily along with other atmospheric parameters at meteorological stations, could play a significant role in reducing the heat-related complications among exposed individuals and a basis for taking appropriate protective measures.
Conclusion:
Based on the results obtained in this study, which has been investigated in Iran for a long period of time, considering intrinsic features of the SSI index, such as ease of calculation and interpretation and also the possibility of calculating the index using daily reported meteorological data, the use of SSI as a screening index of thermal stress in order to adopt preventive policies in outdoor settings in climates of Iran is recommended.
1. INTRODUCTION
The adverse effects of climatic conditions and global warming along with various job tasks requirements, such as wearing heavy or non-breathable protective clothing and equipment, prolonged exposure to the heat sources and lack of proper control measures, particularly for the outdoor jobs and during the hot seasons of the year have contributed to the prevalence of excessive levels of heat stress among employees. Apart from the occupational environments, annually, a large number of people including children, adults and elderlies are exposed to heat and suffer from heat complications such as heat rash, heat exhaustion, heat cramps and heatstroke (Heidari, Golbabaei et al. 2015, Nassiri, Monazzam et al. 2018).
The Islamic Republic of Iran lies in western Asia and includes different types of climates; from completely arid, to Mediterranean and humid areas. However, more than 82% of Iran’s territory is located in the arid and semi-arid parts of the world. People living in such regions, which are mostly located in the central and southern regions of Iran, usually experience hot and very hot summers (Amiri and Eslamian 2010).
According to the statistics of Iranian labor organization, it is estimated that nearly sixteen million employees work in two million job units, of whom 45% work in the service sector, 30% work in agricultural sector and 25% work in industrial sector. These people are exposed to various harmful agents due to their work activities and environment. It can also be estimated that the number of outdoor workers is much higher than those of indoor jobs (about three times). These workers, who often spend long hours in the outdoor environments, might be affected by heat stress through both the natural (due to sunlight) and artificial heating processes. Therefore, in this case, the risk of developing heat stress is more considerable. The concept of bioclimatic comfort was created with the industrial revolution and the rising need for labor and productivity. The deterioration or comfort of working conditions and the relationship between workers' complaints and work performances led to the advent of bioclimatic comfort studies (Toy and Yilmaz 2010).
From the occupational health perspective, the first step in taking preventive policies is to assess the risk of exposure to heat and identify exposed individuals. Numerous indices for assessing thermal comfort and heat stress have been presented so far (more than 100 indices), some of which, like Wet Bulb Globe Temperature (WBGT), introduced by Yaglou and Mynard in 1957 and adopted as a standard in 1989, are widely used and accepted around the world. In spite of the simplicity and the wide applicability of WBGT, as well as the possibility to measure heat stress for both the indoor and the outdoor settings, due to the overdependence of the index on the global temperature, and the need for some estimations (such as metabolic rate and thermal insulation of the clothes), calculation of this index by merely obtaining the data from meteorological organization still remains impossible (Epstein and Moran 2006). Therefore, so far, the applicability of the index for public awareness about the thermal status of the environment by the meteorological organization has been partly restricted. Additionally,the accuracy of WBGT index has been questioned in ambient conditions with higher levels of humidity or very low air velocities (Budd 2008). On the other hand, several other restrictions such as acceptable accuracy and availability, calibrated equipment and qualified personnel, highly sophisticated calculations, the need for estimating parameters, as well as some other intrinsic limitations associated with them, have already restricted the use of many of thermal indices (Epstein and Moran 2006, Budd 2008, Heidari, Golbabaei et al. 2016).
On the other hand, the possibility of measuring the thermal conditions of the environment by taking into account the atmospheric parameters daily recorded by meteorological stations could be recognized as an advantage for an indicator. Since such data are usually comprehensive, inexpensive, accurate, and recorded continuously, they can be used for awareness purposes, particularly for thermal conditions in outdoor environments. Moreover, it would be possible to compare the trend and changes in weather parameters during different periods in the past, present and future (Heidari, Golbabaei et al. 2016). Therefore, many efforts have been made by researchers in the field of heat stress prevention and control to introduce indices based on meteorological data that can be estimated by measuring the minimum available parameters and hence to provide a more realistic view of the thermal conditions of the various environments with minimum requirements (Moran, Pandolf et al. 2001, Gaspar and Quintela 2009).
Due to diverse climates within the territory of Iran, a large number ofoutdoor workers are exposed to excessive levels of heat, and concern about global warming and adverse health consequences (Nassiri, Monazzam et al. 2018), it is essential to assess the changes in weather parameters for enhancing the public awareness and taking appropriate measures. Therefore,this study aimed to assess the thermal comfort trend by considering a metrological parameter based index namely, Summer Simmer Index (SSI), for different climates of Iran during a 30 year-period from 1985 to 2014.
2. METHODOLOGY
2.1. Climatic Categorization and Synoptical Stations
DeMartonne climate classification was used (Heidari, Golbabaei et al. 2015, Heidari, Golbabaei et al. 2018) to classify climates of Iran. This classification is based on the aridity index anduses temperature and precipitation to determine theclimate type. Accordingly, 6 climatic categories were obtained.One of the 6 categories was excluded due to the lack of appropriate and available long-term metrological data which had been recorded in related synoptical stations. Finally, 40 synopticalstations were included in the study from five climatic categories as shown in Table 1.
2.2. Data Collection
To investigate the changes in the SSI values in Iran, long-term metrological data from two variables of mean daily temperature and relative humidity values of 40 synoptic meteorological stations for a 30-year period (1985-2014) were obtained from the meteorological organization of Iran. A large number of stations were used in this investigation to cover the wide climatic diversity in Iran. In order to use meteorological data in these stations, it was necessary to have complete and valid daily data. While in many meteorological stations for various reasons, such as equipment failure, loss of recorded data, uncertainty in recorded readings, etc., there were several deficiencies in the required data in different years between 1985 and 2019. The most complete and reliable data that could be used in these 40 stations were related to the years between 1985 and 2014. Therefore, this period of time was selected for the study.
2.3. Summer Simmer Index (SSI)
Summer Simmer Index (SSI), is a temperature- humidity based index, introduced first by Pepi in 1987 and developed by other researchers (Pepi 1987). It provides a proven indicator of heat stress concerns and discomfort using meaningful equivalent temperature values for general public acceptance and awareness (Pepi 1987, Pepi 2000, Tzenkova, Ivancheva et al. 2007, Alfano, Palella et al. 2010, Morcotet 2012).
Table 1.
| Category Number | Category Name | Description | Selected Stationsb |
| 1 | Arid | Aridity index <10 | Ahwaz, Bam, Bandarabbas, Birjand, Bushehr, Chabahar, Darab, Fasa, Karaj, Kashan, Mashhad, Qom, Sabzevar, Semnan, Shahroud, Tehran, Torbat Heydariyeh, Zabol, Yazd, Zahedan |
| 2 | Semi-arid | 10< Aridity index <20 | Ahar, Arak, Ardebil, Gorgan, Hamedan, Kermanshah, Mahabad, Makoo, Maragheh, Qazvin, Shahrekord, Shiraz, Urmia, Zanjan, Sanandaj |
| 3 | Mediterranean | 20< Aridity index <24 | Saghez |
| 4 | Semi -humida | 24< Aridity index <28 | c |
| 5 | Humid | 28< Aridity index <35 | Babolsar, Yasooj |
| 6 | Very humid | Aridity index ≥35 | Anzali, Rasht |
bCity name or weather station
c Stations without appropriate and useable long- term metrological data
The new SSI is the only temperature-humidity index that uses the sults from proven physiological models and human tests. It can meet all subjective and objective requirements while relating to a dry environment. Therefore, it can be employed both for the detection of feeling thermal conditionand as an indication for warning individuals about heat-related physiological risks. The index can be calculated using Equation 1 and the sensations felt by the human body obtained from Table 2.

Where is:
SSI: Summer simmer index, °F
Ta: Air temperature, °F
RH: Relative humidity, %
2.4. SSI Trend Analysis
In order to investigate the trend analysis of SSI over a 30 year-period from 1985 to 2014, Mann- Kendall test and Sen's Slope were used to compare the upward or downward trend of the index during that period. The Minitab software, version 17.1.0 was used for data analysis.
Mann- Kendall test is one of the most widely-used non-parametric tests for analyzing the trend of time series; using data changes, its type and time are determined (Fathian, Dehghan et al. 2016). In this method, only the increment or decrement trend of a variable in a time series is measured. This test can also determine whether the mean of a time series has changed over time or not. Therefore, this test is widely recommended for general use by the World Meteorological Organization.
Additionally, using the linear regression model in this study, first the SSI index data and the latitudes of the studied stations were called in the Curve Expert software, Version 4.1 and then the data were adjusted to the best theoretical regression functions.
Afterwards, based on regression relationship and Digital Elevation Model (DEM), zoning maps of SSI index values for summer (including June, July and August) were presented using ArcGIS10.3. Finally, we also used SPSS software, version 21 and Microsoft Office Excel, 2013 for more statistical analysis and drawing graphs. Statistical descriptive tests, Pearson correlation coefficient and linear tests were also performed and significance level of less than 0.05 was considered for all the tests.
3. RESULTS
According to the climatic zoning, 47.5% of the studied stations are located in the arid region, 40% in the semi-arid region, 10% in the humid and very humid regions and 2.5% in the Mediterranean region.
| Zone | SSI value (˚F) | Perceived Thermal Sensation | Symbol |
| 1 | 70 ≤ SSI < 77 | Most people are comfortable, but slightly cool | A |
| 2 | 77 ≤ SSI < 83 | Nearly everyone feels quite comfortable | B |
| 3 | 83 ≤ SSI < 91 | Most people are comfortable, but slightly warm | C |
| 4 | 91 ≤ SSI < 100 | Increasing discomfort(warm) | D |
| 5 | 100 ≤ SSI < 112 | A caution of sunstroke and heat exhaustion exists for prolonged exposure and activity, along with significant discomfort (extremely warm) | E |
| 6 | 112 ≤ SSI < 125 | Virtually everyone is uncomfortable, a danger of heatstroke and great discomfort exists (hot) |
F |
| 7 | 125 ≤ SSI < 150 | There is an extreme danger of heatstroke, especially for the weakened or elderly, and even young children. Maximum discomfort exists at these conditions (extremely hot) | G |
| 8 | 150 < SSI | Circulatory collapse is imminent for prolonged exposure |
H |
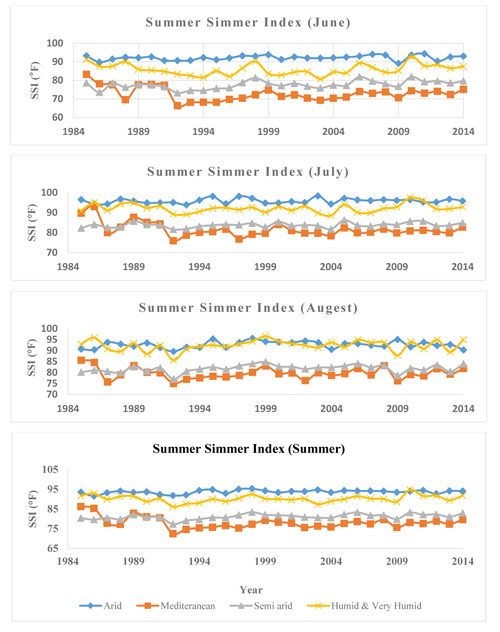
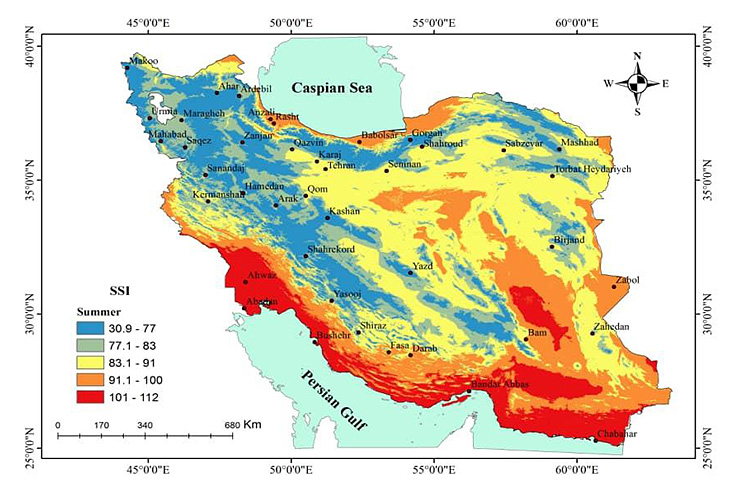
Using required metrological data during 1985 to 2014, the summer simmer index for forty synoptic stations was calculated and the fluctuations of the index in different months of the summers in different climates were compared. The charts of Fig. (1) allow the comparison SSI index fluctuations in different climates and months of the summer over the study period. The obtained results showed that, based on the SSI values, the arid climate has experienced more thermal discomfort during all summer months, so that the SSI values have ranged between 90 to nearly 100 °F, indicating an increasing discomfort status (Table 2). On the other hand, the Mediterranean and semi-arid climates were mostly in nearly comfort status (except some synoptic stations in Mediterranean climate with a little cool feeling). The mean and standard deviations of SSI values of studied synoptic stations during the 30-year period in different months of the summers are shown in Table 3. In addition to that, the trend analysis of SSI over this 30 year- period, was performed using Mann- Kendall test and Sen's Slope -was used to compare the upward or downward trend of the index during this time (Table 4). Having calculated the SSI values for the studied synoptic stations by ArcGIS 10.3, the zoning was performed to indicate thermal comfort or discomfort conditions of each studied station during the summer months on the geographical map of Iran (Fig. 2).
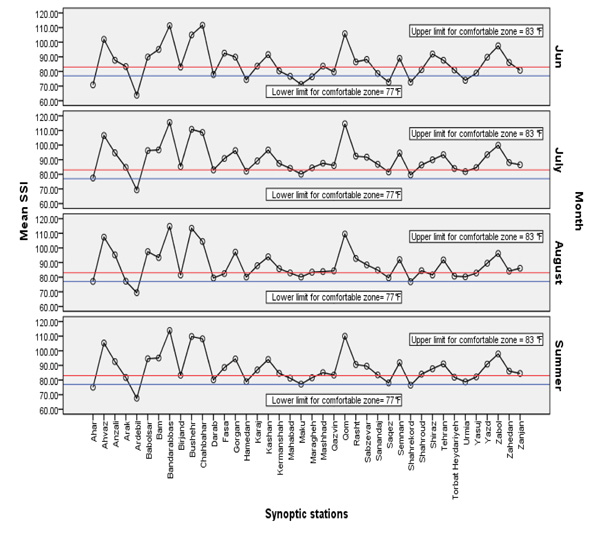
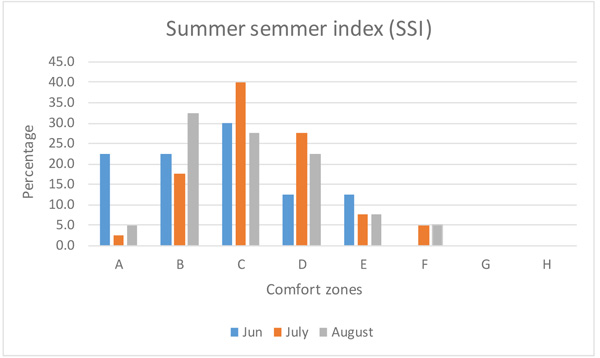
To determine which stations in which months of the summers have indicated the discomfort condition, further analysis was conducted considering the defined limits for SSI values (Table 2). According to the results shown in Fig. (3) and based on the mean of SSI values, a few stations are within the comfort zone in which nearly everyone feels fairly comfortable (77≤SSI<83°F). Stations located in the north-west of the country such as Ardabil, Urmia and Maku were often in comfort status, especially at June. On the other hand, stations located in the southwest (such as Ahvaz) and southern of Iran (such as Bandar Abbas and Chabahar) experience very unfavorable thermal conditions throughout the summer. SSI index in these areas was higher than 100. Fig. (4) shows the different climatic zones in which the studied stations are located in different months of the year. Accordingly, none of the studied stations in any of the summer months were located in the comfort zones of G and H, which indicate severe thermal discomfort. Moreover, in June, no stations were located in comfort zone of F (112≤SSI<125 °F), which indicate hot condition. Totally, most of the stations have experienced thermal conditions B, C and D based on the comfort classification shown in Table 2.
| No. of Stations | Synoptic Stations | Summer Simmer Index (M±SD), ˚F | |||
| June | July | August | Summer (Totally) | ||
| 1 | Ahar | 70.8±7.1 | 77.48±5.78 | 77.1±6 | 75.06±6.93 |
| 2 | Ahvaz | 101.92±3.88 | 106.51±4 | 107.35±5 | 105.3±5 |
| 3 | Anzali | 87.68±6.6 | 94.66±5.3 | 95.27±6 | 92.6±6.93 |
| 4 | Arak | 83.35±5.33 | 84.73±3.86 | 77.2±6.3 | 81.72±6.2 |
| 5 | Ardebil | 63.78±8 | 69.33±6.4 | 69.4±7.3 | 67.54±7.73 |
| 6 | Babolsar | 89.85±5.8 | 96.19±4.8 | 97.45±5.4 | 94.55±6.3 |
| 7 | Bam | 95.06±4.67 | 96.7±4.4 | 93.4±4.5 | 95.07±4.75 |
| 8 | Bandarabbas | 111.3±3.4 | 115.45±2.6 | 114.7±2.86 | 113.85±3.47 |
| 9 | Birjand | 83±5 | 85.3±4.4 | 81.46±4.6 | 83.26±4.93 |
| 10 | Bushehr | 104.95±3.7 | 110.73±3.8 | 113.44±4.1 | 109.76±5.24 |
| 11 | Chahbahar | 111.6±3.4 | 108.6±3.6 | 104.4±3.7 | 108.17±4.64 |
| 12 | Darab | 77.9±4.2 | 83±4 | 79.47±3.94 | 80.15±4.6 |
| 13 | Fasa | 92.52±4 | 90.83±3.6 | 82.44±4.65 | 88.55±6.04 |
| 14 | Gorgan | 89.8±5.9 | 96.2±4.6 | 97.1±5 | 94.43±6.1 |
| 15 | Hamedan | 74.35±5 | 82.1±4 | 80.1±4.1 | 78.87±5.5 |
| 16 | Karaj | 83.65±5.45 | 89.12±4.54 | 87.85±4.67 | 86.93±5.41 |
| 17 | Kashan | 91.52±4.3 | 96.6±3.67 | 93.94±3.7 | 94.05±4.4 |
| 18 | Kermanshah | 80.35±4.46 | 87.4±3.6 | 85.83±3.7 | 84.58±4.95 |
| 19 | Mahabad | 76.68±5.1 | 84.1±3.95 | 82.9±4.1 | 81.27±5.46 |
| 20 | Maku | 71.1±7.3 | 80.16±5.47 | 80.14±5.1 | 77.2±7.4 |
| 21 | Maragheh | 76.38±5.73 | 84.4±4.4 | 83.42±4.47 | 81.58±6 |
| 22 | Mashhad | 83.64±5.2 | 87.58±4.3 | 83.83±5.2 | 85.03±5.3 |
| 23 | Qazvin | 79.68±5.1 | 86±4 | 84.33±3.97 | 83.4±5.15 |
| 24 | Qom | 105.78±8.3 | 114.5±7.96 | 109.48±7.2 | 109.95±8.64 |
| 25 | Rasht | 86.5±6.9 | 92.43±5.5 | 92.8±6.35 | 90.62±6.91 |
| 26 | Sabzevar | 88.2±4.98 | 91.7±4.1 | 88.4±4.6 | 89.46±4.87 |
| 27 | Sanandaj | 78.62±4.95 | 86.85±4 | 84.88±4.2 | 83.51±5.62 |
| 28 | Saqez | 72.72±6 | 81.58±5.5 | 79.6±4.6 | 78.04±6.58 |
| 29 | Semnan | 88.95±5.1 | 94.51±4.2 | 92±4.6 | 91.86±5.17 |
| 30 | Shahrekord | 72.65±4.3 | 79.6±3.7 | 76.89±3.8 | 76.43±4.88 |
| 31 | Shahroud | 81.2±5.54 | 86.38±4.98 | 84.44±5. 1 | 84.05±5.62 |
| 32 | Shiraz | 91.91±3.4 | 89.9±3.4 | 81.52±4.26 | 87.73±5.85 |
| 33 | Tehran | 87.64±4.9 | 93.39±3.95 | 91.82±4.2 | 91.05±5 |
| 34 | Torbat Heydariyeh | 80.98±5 | 83.97±4.1 | 80.7±4.7 | 81.9±4.87 |
| 35 | Urmia | 73.95±5.8 | 81.85±4.5 | 80.27±4.36 | 78.76±6 |
| 36 | Yasuj | 78.84±3.9 | 84.6±3.67 | 82.83±3.53 | 82.13±4.4 |
| 37 | Yazd | 89.7±3.97 | 93.4±4 | 89.54±4.3 | 90.9±4.48 |
| 38 | Zabol | 97.5±5 | 99.86±4.2 | 96.2±4.69 | 97.86±4.9 |
| 39 | Zahedan | 86.1±4.2 | 88±3.9 | 84.16±4 | 86.1±4.36 |
| 40 | Zanjan | 80.78±5.4 | 86.5±4.1 | 86.1±4.3 | 84.5±5.3 |
Table 4.
| June | July | August | ||||||||
| No. of Stations | Synoptic Stations | pa | Trend | Sen's Slope | p | Trend | Sen's Slope | p | Trend | Sen's Slope |
| 1 | Ahar | 0.15 | Ub | 0.91 | 0.41 | Dc | -0.07 | 0.38 | U | 0.21 |
| 2 | Ahvaz | < 0.001 | U | 1.36 | 0.01 | U | 1.04 | 0.05 | U | 1.08 |
| 3 | Anzali | 0.14 | U | 0.87 | 0.11 | U | 0.91 | 0.01 | U | 1.63 |
| 4 | Arak | < 0.001 | U | 3.35 | 0.005 | D | -1.23 | 0.001 | D | -3.08 |
| 5 | Ardebil | 0.01 | U | 1.9 | 0.003 | U | 2.05 | < 0.001 | U | 3.14 |
| 6 | Babolsar | 0.11 | U | 0.87 | 0.13 | U | 0.63 | 0.01 | U | 1.33 |
| 7 | Bam | 0.32 | U | 0.22 | 0.45 | U | 0.07 | 0.19 | U | 0.59 |
| 8 | Bandarabbas | 0.12 | U | 0.36 | 0.04 | U | 0.52 | 0.37 | U | 0.12 |
| 9 | Birjand | 0.03 | U | 0.88 | 0.12 | U | 0.63 | 0.06 | U | 0.86 |
| 10 | Bushehr | < 0.001 | U | 1.41 | 0.20 | U | 0.32 | 0.02 | U | 1.35 |
| 11 | Chahbahar | 0.33 | D | -0.13 | 0.11 | D | -0.51 | 0.20 | U | 0.48 |
| 12 | Darab | 0.19 | U | 0.45 | 0.47 | D | -0.08 | 0.42 | D | -0.10 |
| 13 | Fasa | 0.003 | U | 1.65 | 0.07 | U | 0.50 | 0.41 | U | 0.06 |
| 14 | Gorgan | 0.06 | U | 0.98 | 0.01 | U | 1.05 | 0.005 | U | 1.45 |
| 15 | Hamedan | 0.02 | U | 0.83 | 0.06 | U | 0.51 | 0.09 | U | 0.70 |
| 16 | Karaj | 0.42 | U | 0.12 | 0.50 | U | 0.01 | 0.42 | U | 0.17 |
| 17 | Kashan | 0.30 | U | 0.22 | 0.22 | U | 0.33 | 0.50 | U | -0.02 |
| 18 | Kermanshah | 0.001 | U | 1.35 | 0.38 | U | 0.17 | 0.08 | U | 0.70 |
| 19 | Mahabad | 0.007 | U | 1.21 | 0.02 | U | 0.70 | 0.004 | U | 1.12 |
| 20 | Maku | 0.07 | U | 1.21 | 0.27 | U | 0.41 | 0.07 | U | 0.92 |
| 21 | Maragheh | 0.001 | U | 1.83 | 0.003 | U | 1.14 | < 0.001 | U | 1.65 |
| 22 | Mashhad | 0.15 | U | 0.50 | 0.34 | U | 0.19 | 0.07 | U | 0.70 |
| 23 | Qazvin | 0.014 | U | 1.03 | 0.01 | U | 0.81 | 0.04 | U | 0.72 |
| 24 | Qom | 0.10 | U | 1.15 | 0.04 | U | 1.31 | 0.36 | D | -0.41 |
| 25 | Rasht | 0.33 | U | 0.53 | 0.14 | U | 0.63 | 0.027 | U | 1.55 |
| 26 | Sabzevar | 0.34 | D | -0.11 | 0.14 | D | -0.42 | 0.38 | D | -0.17 |
| 27 | Sanandaj | 0.001 | U | 1.60 | 0.34 | D | -0.08 | 0.03 | U | 0.67 |
| 28 | Saqez | 0.40 | U | 0.25 | 0.15 | D | -0.69 | 0.42 | U | 0.12 |
| 29 | Semnan | 0.08 | U | 0.71 | 0.10 | U | 0.57 | 0.48 | U | 0.03 |
| 30 | Shahrekord | 0.33 | U | 0.11 | 0.18 | D | -0.23 | 0.02 | D | -0.88 |
| 31 | Shahroud | 0.07 | U | 0.71 | 0.05 | U | 0.97 | 0.06 | U | 0.64 |
| 32 | Shiraz | 0.44 | U | 0.11 | 0.30 | U | 0.22 | 0.44 | D | -0.08 |
| 33 | Tehran | 0.36 | U | 0.06 | 0.41 | D | -0.09 | 0.41 | D | -0.28 |
| 34 | Torbat Heydariyeh | 0.20 | U | 0.38 | 0.13 | U | 0.41 | 0.06 | U | 0.84 |
| 35 | Urmia | 0.007 | U | 1.47 | 0.06 | U | 0.70 | 0.02 | U | 1 |
| 36 | Yasuj | 0.22 | D | -0.29 | 0.18 | D | -0.31 | 0.05 | D | -0.49 |
| 37 | Yazd | 0.40 | D | -0.05 | 0.32 | U | 0.28 | 0.41 | U | 0.19 |
| 38 | Zabol | 0.14 | D | -0.47 | 0.06 | D | -0.72 | 0.36 | D | -0.24 |
| 39 | Zahedan | 0.33 | U | 0.09 | 0.50 | - | 0 | 0.11 | U | 0.56 |
| 40 | Zanjan | 0.02 | U | 1.57 | < 0.001 | U | 1.54 | < 0.001 | U | 2.10 |
b Upward
c Downward
4. DISCUSSION
Our findings suggest that Summer Simmer Index (SSI) can be simply applied as a thermal comfort index in evaluation of thermal conditions in different climates.
Based on the results illustrated in Fig. (1), the SSI values have been between 90 and nearly 100 °F which is an indication of the fact that the arid climate has experienced more thermal discomfort during all months of the summers (Table 2). It is also evident that the most arid regions have been located in the Center and South of the country. Similarly, in another study, it was revealed that the maximum thermal stress based on the Wet Bulb Globe Temperature (WBGT) index could be seen in the Centre and South of the country (Heidari, Golbabaei et al. 2015). In other words, the cities of Ahwaz, Bam, Bandarabbas, Birjand, Bushehr, Chabahar, Darab, Fasa, Karaj, Kashan, Mashhad, Qom, Sabzevar, Semnan, Shahroud, Tehran, Torbat Heydariyeh, Zabol, Yazd, Zahedan, which are located in the Centre and South of Iran, have anarid climate and therefore experience excessive levels of thermal stress during the hot seasons.
These areas have mostly long hours of sun irradiation during the day. Aljawabraand Nikolopoulou indicated that the levels of thermal comfort are directly related to the levels solar irradiation, so that the time spent by the people in outdoor environment decreased whenever duration of solar irradiation increased (Aljawabra and Nikolopoulou 2010). As a result of this interpretation, in central regions of Iran, such as the cities of Qom and Yazd, due to the prolonged duration of solar irradiation, immoderate thermal discomfort levels are observed during the day. Moreover, the moisture content in the air is not significant in these areas. For instance, in several regions in the of the center of Iran, the relative humidity is as low as 20–30% while the dry bulb temperature reaches 50° C.It should also be mentioned that SSI can only be calculated for air temperatures between +22°C and +53°C. Above +53°C, the index only displays values which indicate a fairly warm bioclimate and induces considerable bioclimatic discomfort due to overheating (Pepi 1987, Pepi 2000). In a research on applicability of SSI for different time intervals and air temperatures, the findings showed that the SSI cannot be used with satisfactory results when the air temperatures were up to 14°C (Mihăilă, Bistricean et al. 2016).
On the other hand, the southern areas of Iran which mostly have an arid climate and are very hot, due to the vicinity to the Oman sea and the Persian Gulf, not only experience very high air temperatures (more than 35 °C), but also come up with excessive levels of relative humidity (more than 60%). The combined effect of these two environmental factors plays a vital role in the development of heat stress in these areas. Therefore, as shown in the map in Fig. (2), the worst thermal discomfort conditions based on SSI can be seen in the southern areas as well. In other words, the humidity is another critical parameter, which may contribute to the exorbitant levels of thermal discomfort when coupled with high temperature (Heidari, H 2014).
The other two climates including Mediterranean and semi-arid were mostly within nearly comfort status (The SSI values were less than 85 °F). These areas mainly include the cities of Saqez, Ahar, Ardebil, Kermanshah, Mahabad, Makoo, Maragheh, Shahrekord, Urmia andSanandaj, which are located on the Northwest of Iran. These results are in tandem with the ones from the other published researches (Farajzadeh and Matzarakis 2009, Farajzadeh and Ahmad Abadi 2010, Heidari H 2012). These studies have investigated the thermal comfort of Iranian climates using Tourism Climate Index (TCI) and Holiday Climate Index (HCI) and concluded that the thermal comfort conditions related tourist and tourism industry in the summer months of the year in the northwest of the country, for instance in the city of Urmia, were extremely reasonable. In another study conducted in Turkey, a country bordering northwest of Iran, the time periods between June the 5th to 25th as well as August 29th to September 16th were the most appropriate periods in the study area on average in terms of the thermal comfort for the tourism and outdoor recreational activities (Guclu 2016).
Furthermore, in humid and very humid climates of Iran, the increasing discomfort status toward SSI values more than 90 °F was seen during July and August months. The relative humidity of these regions is commonly immoderately high (due to vicinity to the Caspian Sea) without necessarily very high levels of temperature. Also, as Alborz mountain range is located along the Caspian Sea, staggering amount of vegetation coverage is formed on these areasas well. However, as shown in our study, the appropriate thermal comfort cannot be attained in these climates. Therefore, it can be concluded that the effect of humidity on SSI changes is more considerable than the air temperature in such climates.The findings of other research also indicated that some local topo climatic conditions such as the sand-duned region in the southern part of the Oltenia Plain and the air-masses circulation pattern in this region may play a major part in intensifying the bioclimatic stress (Ionac N 2007).
The results demonstrated in Table 4 showed that the trend of changes in SSI values from 1985 to 2014 was mostly upward based on the Sen's slope values (more than 80% of the cases). However, only up to 30% of the cases were significantly different in rising the air temperature and the SSI values (P<0.001). In a study conducted by Heidari et al. the thermal status of different climates of Iran was studied using WBGT. It was revealed that the south, west south, east south and large areas of central parts of Iran have experienced very hot situations, not only in the summer, but also during the spring time (Heidari, Golbabaei et al. 2015). With regard to the status of the existing and projected thermal stress in relation to the air temperature increase, particularly in the central and southern parts of Iran, outdoor workers will definitely experience higher levels of thermal discomfort in the future.
More analysis was performed to determine which stations in which months of the year were within the discomfort conditions. According to the results shown in Fig. (3) and based on the mean of SSI values, a few stations were within comfort zone that is defined as the zone in which nearly everyone feels quite comfortable (77≤SSI<83°F). These stations include Yasuj, Urmia, TorbatHeydariyeh, Saqez, Maku, Maragheh, Mahabad, Hamedan, Darab and Arak. In other words, during June,nearly 22% of studied stations had been in comfort zone of “B”, in which nearly everyone feels quite comfortable. These levels for July and August in this comfort zone were nearly 17% and 32%, respectively (Fig. 4). However, most stations were within the comfort zone of “C” and then the percentage of areas with thermal discomfort decreased gradually. Therefore, none of the areas were observed in the comfort zones of “G” and “H”. These recent categories indicate an alarming risk of developing heatstroke, particularly for the elderly individuals, people with disabilities and even young adults. In addition to that, the maximum discomfort exists in these conditions and circulatory collapse is likely imminent for prolonged exposures (Tzenkova, Ivancheva et al. 2007, Sancar and Güngör 2020).
Among all evaluated indices, the HUM (Humidex), HEI (Heat Index), AP (Apparent Temperature), WBGT (Wet Bulb Globe Temperature), DSI (Discomfort Index), SSI (Summer Simmer Index), ESI (Environment Stress Index), NET (Net Effective Temperature), and NWB (Natural Wet Bulb Temperature) have the advantages of being well-validated and high usability for measuring Perceived Temperature (PT) globally (Heidari H 2012, Heidari, Golbabaei et al. 2016, Wang and Zhu 2020).
Since the evaluation of environmental parameters for the calculation of heat stress indices is usually costly and time consuming, it is possible to use daily-recorded weather station data to resolve this problem particularly for environmental evaluations of open spaces (Heidari, Golbabaei et al. 2016). The meteorological data have the advantage of being continuously recorded and provide an inexpensive and yet comprehensive database for calculating many important thermal indicators.
Moreover, similar to the results from most of the previous studies in this field, the present study demonstrated that there is a significant correlation coefficient between the measured environmental data and the meteorological data, justifying the efficiency of using this data for environmental issues (Ghalhari, Dehghan et al. 2019, Golbabaei, Heidari et al. 2019, Heidari, Golbabaei et al. 2019).
Finally, referring to the beneficial characteristics such as ease of calculation and interpretation, dealingonly with two environmental parameters (air temperature and humidity), availability of the daily reported meteorological data, applicability for other similar climates, the SSI can be recommended as a screening indicator for the preliminary assessment of thermal conditions of outdoor settings worldwide. This initial assessment, which can be reported daily along with other atmospheric parameters at meteorological stations, could play a significant role in reducing heat-related complications among those who are exposed to heat and a basis for taking protective measures, particularly when heat waves occur.
CONCLUSION
Based on the summer simmer index, the thermal conditions vary in different climates of the country. The worst thermal condition was observed in the southern areas of Iran with mostly arid climate. The central regions were the next in the hierarchy. The fluctuations of SSI changes were not considerable during the studied period for nearly 70% of cases (p<0.05). However,the trend of changes was commonly upward, indicating rising temperature. Considering a long term investigation of meteorological parameters in present study, the possibility of calculating the SSI using daily reported meteorological data, and other advantages of the SSI index, such as ease of calculation and interpretation, the use of SSI as a screening index of thermal stress in order to adopt preventive policies in outdoor settings in climates of Iran is recommended.
ETHICS APPROVAL AND CONSENT TO PARTICIPATE
Not applicable.
HUMAN AND ANIMAL RIGHTS
Not applicable.
CONSENT FOR PUBLICATION
Not applicable.
AVAILABILITY OF DATA AND MATERIALS
Not applicable.
FUNDING
This research has been supported by Golestan University of Medical Sciences (Approval no. IR.GOUMS.REC.1400. 132).
CONFLICT OF INTEREST
The authors declare that they have no any conflict of interest.
ACKNOWLEDGEMENTS
This research has been supported by Golestan University of Medical Sciences (Approval no. IR.GOUMS. REC.1400.132). Hereby, the university co-operation is highly appreciated. The authors also thank the meteorological organization of the studied provinces for provision of required data.
REFERENCES
[CrossRef Link]
[PubMed Link]
[CrossRef Link] [PubMed Link]
[CrossRef Link] [PubMed Link]
[CrossRef Link]
[CrossRef Link]
[CrossRef Link] [PubMed Link]
[CrossRef Link]
[CrossRef Link]
[CrossRef Link]
[CrossRef Link] [PubMed Link]
[CrossRef Link] [PubMed Link]
[PubMed Link]
[CrossRef Link]
[CrossRef Link]
[CrossRef Link]

