All published articles of this journal are available on ScienceDirect.

The Impact of Environment on Human Development and Sustainable Development in Arab Countries

Abstract
Introduction
This study explored the effect of environmental variables on Human Development in Arab countries.
Methods
Principal Component Analysis and hierarchical clustering were applied to data from the Human Development Report 2025, while additional data from other sources were used to compare Arab countries' environmental performance.
Results
The Principal Component Analysis clearly shows that rich Gulf countries lose a significant share of their Human Development Index due to planetary pressures (per capita carbon dioxide emissions and per capita material footprint). Additionally, a hierarchical clustering method was also implemented, classifying the 22 Arab countries into 4 groups: Group 1 (Algeria, Comoros, Egypt, Iraq, Jordan, Lebanon, Libya, Morocco, Palestine, Tunisia), Group 2 (Djibouti, Mauritania, Somalia, Sudan, Syria, Yemen), Group 3 (Bahrain, Kuwait, Oman, Saudi Arabia, United Arab Emirates) and Group 4 (Qatar).
Discussion
The results obtained by applying Principal Component Analysis and a hierarchical clustering method agree perfectly with the ranking provided by the new Planetary pressures-adjusted Human Development Index introduced by the United Nations Development Programme in 2021. The analysis shows that ranking countries only by their Human Development Index score, while ignoring sustainability and environmental effects, yields a potentially misleading ranking.
Conclusion
The performance of Arab countries was also explored through different environmental indicators, including: the Environmental Sustainability Index, the Human Sustainable Development Index, the Ocean Health Index, the National Sustainable Development Index, the Planetary pressures-adjusted Human Development Index, the Environmental Performance Index, the Sustainable Development Goals Index, and the Climate Change Performance.
1. INTRODUCTION
The League of Arab States (LAS) includes the following 22 countries: Algeria, Bahrain, Comoros, Djibouti, Egypt, Iraq, Jordan, Kuwait, Lebanon, Libya, Mauritania, Morocco, Oman, Palestine, Qatar, Saudi Arabia, Somalia, Sudan, Syria, Tunisia, United Arab Emirates (UAE), and Yemen. According to WorldData, the total population of these 22 countries is around 480 million (as of June 2025), representing about 5.9% of the world's population (WorldData.info, 2024). In 2000, the population of the 22 Arab countries was about 280 million, representing approximately 5% of the world's population, meaning that the population has increased by 71% in 24 years.
More than 76% of inhabitants live in seven countries: Egypt (23.9%), Sudan (10.4%), Algeria (9.6%), Iraq (9.4%), Yemen (8.2%), Morocco (7.8%), and Saudi Arabia (6.9%) (Table 1) (WorldData.info, 2024).
| Country | Population (in millions) |
Country | Population (in millions) |
Country | Population (in millions) |
|---|---|---|---|---|---|
| Algeria | 46.16 | Lebanon | 5.49 | Somalia | 18.36 |
| Bahrain | 1.58 | Libya | 6.81 | Sudan | 50.04 |
| Comoros | 0.85 | Mauritania | 4.74 | Syria | 23.59 |
| Djibouti | 1.15 | Morocco | 37.46 | Tunisia | 12.20 |
| Egypt | 114.54 | Oman | 4.58 | UAE | 10.48 |
| Iraq | 45.07 | Palestine | 5.04 | Yemen | 39.39 |
| Jordan | 11.44 | Qatar | 2.70 | - | - |
| Kuwait | 4.85 | Saudi Arabia | 33.26 | Total | 479.78 |
Source: WorldData (WorldData.info, 2024).
The 22 Arab countries can be subdivided into two groups. The first group of African countries includes Algeria, Comoros, Djibouti, Egypt, Libya, Mauritania, Morocco, Somalia, Sudan, and Tunisia, while the second group of Middle East countries includes Bahrain, Kuwait, Iraq, Jordan, Lebanon, Oman, Palestine, Qatar, Saudi Arabia, Syria, UAE, and Yemen.
Bahrain, Kuwait, Oman, Qatar, Saudi Arabia, and the UAE are also members of the Gulf Cooperation Council (GCC).
The Middle Eastern Arab countries are often grouped as the “West Asia region,” which includes the GCC sub-region and the Mashriq sub-region (Iraq, Jordan, Lebanon, Palestine, Syria, and Yemen).
Although Arab countries share religion, culture, language, and a great part of lifestyle, the Arab League is characterised by huge differences in terms of economic status (World Bank, 2024; Boutayeb, 2023), health indicators (World Health Organization, 2024; Boutayeb & Serghini, 2006), education achievements (ESCWA, 2024), human development (Boutayeb & Serghini, 2006; UNDP, 2024), and sustainable development (ESCWA, 2021; El-Zein et al., 2014; Boutayeb, 2024).
Over the last two decades, numerous environmental indicators have been proposed by various authors and international organisations to address the lack of environmental variables in the calculation of the Human Development Index (HDI) and to promote sustainability (Esty et al., 2005; Togtokh & Gaffney, 2010; Togtokh, 2011; Bravo, 2014; Halpern et al., 2012; Jin et al., 2020; UNDP, 2020; Block et al., 2024; Sachs et al., 2025).
Without being exhaustive, we will consider the following environmental composite indicators:
- The Environmental Sustainability Index (ESI) published in 2005 by Esty and collaborators as a composite indicator based on 21 indicators classified into five categories (Esty et al., 2005),
- The Human Sustainable Development Index (HSDI) proposed by Togtokh and Gaffney in 2010, augmenting the HDI by adding the CO2 emissions as a fourth variable (Togtokh & Gaffney, 2010; Togtokh, 2011) and also considered by Bravo in 2014 (Bravo, 2014),
- The Ocean Health Index (OHI) was proposed by Halpern et al. in 2012 as a linear weighted sum of the scores for each of the public goal indices (I1, I2, . . ., I10) and the appropriate weights for each of the following public goals: (1) Food provision (Fisheries, Mariculture), (2) Artisanal fishing opportunity, (3) Natural products, (4) Carbon storage, (5) Coastal protection, (6) Tourism and recreation, (7) Coastal livelihoods and economies (Livelihoods, Economies), (8) Sense of place, (9) Clean water, (10) Biodiversity (Halpern et al., 2012). The OHI 2025 covered 220 coastal countries and territories.
- The National Sustainable Development Index (NSDI) published by Jin et al. in 2020 as a composite index constructed from 12 single indices derived from the three sustainable development dimensions (economy, society, and environment) (Jin et al., 2020).
- The Planetary pressures-adjusted Human Development Index (PHDI) introduced by UNDP in the Human Development Report 2021-2022 and subsequently in the reports (HDR 2023-2024 and HDR 2025) (UNDP, 2020),
- The Environmental Performance Index (EPI), released in 2024 by Esty et al., extending their previous work (ESI). The EPI is a comprehensive composite index derived from 58 performance indicators related to 11 environmental issue categories, and three policy objectives (improving environmental health, protecting ecosystem vitality, and mitigating climate change) (Block et al., 2024).
- The Sustainable Development Goals Index (SDGI) was launched by the Sustainable Development Solutions Network (SDSN) and the Bertelsmann Stiftung in 2016 to track SDG progress (Sachs et al., 2025).
- The Climate Change Performance Index (CCPI) estimates GHG (Greenhouse Gas Emissions) in 63 countries and the European Union, which together contribute to more than 90% of global greenhouse gas emissions. The CCPI uses 14 indicators covering Greenhouse Gas Emissions (40% of the overall score), Climate Policy (20%), Energy Use (20%), and Renewable Energy (20%) (Climate Change Performance Index, 2025).
2. MATERIALS AND METHOD
In this study, Principal Component Analysis (PCA) is used to illustrate the effect of the two environmental variables (CO2 emissions per capita and material footprint per capita) on the HDI in the Arab region. The PCA is one of the most popular data mining statistical methods used to uncover patterns and structure in the data by revealing the correlations between variables and the eventual clustering between individuals. It summarizes the information by replacing the original variables with linear combinations of these variables. Technically, spectral analysis of the data matrix determines the eigenvalues in descending order and the associated eigenvectors. The first axis associated with the largest eigenvalue in absolute value gives the greatest summary of information, while supplementary information is given by the second axis, the third axis, and so on. The projection of variables and individuals onto the plane formed by the first and second axes provides an illustration of the relationships between variables and between individuals, as well as an analysis of individuals and variables. The quality of the graphical interpretation depends on the percentage of variance explained by the first and second eigenvalues. The PCA also provides the correlation between all the variables used, including supplementary variables (eventually).
It is worth stressing that the interpretation and analysis of PCA data and graphs along the second axis should be made in relation to the results provided by the first axis. Among different data analysis methods, PCA is the most commonly used for quantitative data, while factor analysis is the preferred method for qualitative data. Moreover, PCA may yield the same classification (for individuals/countries) as a clustering method, while providing important information on the correlations between different variables.
To complement the PCA results, a hierarchical clustering method is implemented as an alternative multivariate approach to confirm or refute them.
Besides the UNDP’s data used to run the PCA and the hierarchical clustering method, data from other sources are also used to compare the performance of Arab countries in terms of environmental indicators and to track the evolution of Arab countries in terms of sustainability.
3. RESULTS AND DISCUSSION
3.1. Data used to Run the Principal Component Analysis
A Princiapal Component Analysis is carried out using data provided by the HDR 2025 on life expectancy at birth (LEB in years), expected years of schooling (EYS in years), mean years of schooling (MES in years), per capita income (GNI in 2021 PPP $), CO2 emissions per capita (CO2 in tonnes), and the material footprint per capita (MFP in tonnes). These 6 variables are associated with the 22 Arab countries. However, the CO2 index and the MFP index are used instead of the raw data because PHDI is computed as the product of the HDI and (1 – index of planetary pressures), where (1 – index of planetary pressures) serves as an adjustment factor (Table 2) (UNDP, 2020; UNDP, 2025).
| Country | LEB (years) |
EYS (years) |
MYS (years) |
GNI PPP$ |
CO2 (tonnes) |
CO2 (Index) |
MFP (tonnes) |
MFP (Index) |
|---|---|---|---|---|---|---|---|---|
| UAE | 82.9 | 15.6 | 13.0 | 71142 | 24.1 | 0.685 | 39.8 | 0.559 |
| Qatar | 82.4 | 13.1 | 10.8 | 105353 | 42.6 | 0.444 | 74.1 | 0.179 |
| Bahrain | 81.3 | 15.9 | 11.1 | 52819 | 24.6 | 0.679 | 24.6 | 0.728 |
| Kuwait | 80.4 | 15.9 | 7.6 | 56612 | 23.0 | 0.699 | 40.8 | 0.548 |
| Oman | 80.0 | 13.4 | 11.9 | 36096 | 16.9 | 0.779 | 38.5 | 0.574 |
| Saudi Arabia | 78.7 | 16.9 | 11.6 | 50299 | 19.9 | 0.74 | 23.5 | 0.739 |
| Jordan | 77.8 | 13.1 | 10.2 | 9222 | 1.9 | 0.976 | 7.4 | 0.918 |
| Lebanon | 77.8 | 11.7 | 10.4 | 11299 | 3.6 | 0.953 | 10.3 | 0.886 |
| Tunisia | 76.5 | 14.7 | 7.6 | 12011 | 2.6 | 0.966 | 7.3 | 0.919 |
| Algeria | 76.3 | 15.5 | 7.4 | 15114 | 3.9 | 0.949 | 8.8 | 0.902 |
| Morocco | 75.3 | 15.1 | 6.2 | 8653 | 1.8 | 0.976 | 5.8 | 0.935 |
| Iraq | 72.3 | 12.4 | 6.8 | 12654 | 3.9 | 0.949 | 3.2 | 0.964 |
| Syria | 72.1 | 7.4 | 5.9 | 3918 | 1.1 | 0.986 | 2.2 | 0.976 |
| Egypt | 71.6 | 13.1 | 10.1 | 16218 | 2.4 | 0.969 | 3.9 | 0.956 |
| Libya | 69.3 | 12.9 | 7.8 | 19831 | 8.9 | 0.884 | 12.7 | 0.859 |
| Yemen | 69.3 | 7.5 | 5.5 | 1018 | 0.3 | 0.996 | 1.6 | 0.982 |
| Mauritania | 68.5 | 7.9 | 4.9 | 6267 | 0.9 | 0.988 | 5.8 | 0.936 |
| Comoros | 66.8 | 13.3 | 6.0 | 3481 | 0.5 | 0.993 | 5.1* | 0.940* |
| Sudan | 66.3 | 8.6 | 4.0 | 2810 | 0.4 | 0.995 | 4.2 | 0.954 |
| Djibouti | 66.0 | 6.2 | 4.0 | 6368 | 0.4 | 0.994 | 11.0 | 0.878 |
| Palestine | 65.2 | 13.0 | 10.1 | 6547 | 0.7 | 0.992 | 4.9 | 0.946 |
| Somalia | 58.8 | 7.5 | 1.9 | 1475 | 0.0 | 1.000 | 3.7 | 0.959 |
Note: * Value not provided by HDR 2025; it is estimated from countries of similar economic status.
3.1.1. Correlation between Variables
Applying the PCA to the data in Table 2 yields interesting insights into the relationships among the six variables, particularly regarding the impact of environmental variables on HDI in the Arab region.
First of all, Table 3 shows that the first and second components explain, respectively, 75.42% and 15.48% of the variance, and consequently, the first plane will explain 90.91% of the variance.
| Component | Value | % of Variance Explained | % of Cumulated Variance Explained |
|---|---|---|---|
| 1 | 4525 | 75.421 | 75.421 |
| 2 | 929 | 15.484 | 90.906 |
| 3 | 285 | 4.749 | 95.655 |
| 4 | 203 | 3.382 | 99.036 |
| 5 | 47 | 0.779 | 99.816 |
| 6 | 11 | 0.184 | 100 |
Secondly, Table 4 indicates that the first four variables (those used to compute the HDI) are positively correlated with each other and negatively correlated with the two environmental variables (CO2 and MFP), which are, in turn, highly positively correlated with each other (R=0.95).
| LEB | EYS | MYS | GNI | CO2 | MFP | |
|---|---|---|---|---|---|---|
| LEB | 1 | 0.703 | 0.779 | 0.734 | -0.725 | -0.674 |
| EYS | - | 1 | 0.709 | 0.532 | -0.514 | -0.410 |
| MYS | - | - | 1 | 0.639 | -0.618 | -0.555 |
| GNI | - | - | - | 1 | -0.988 | -0.953 |
| CO2 | - | - | - | - | 1 | 0.955 |
| MFP | - | - | - | - | - | 1 |
It is worth highlighting the strong negative correlation (-0.99) between GNI and the CO2 index in Arab countries. The relationship between GDP and CO2 emissions has been explored by researchers in different regions of the world (Zhigolli & Fetai, 2024; Obiora et al., 2021; Rajabi Kouyakhi, 2022).
Using data from the Western Balkan countries (2011-2022), Zhigolli and Fetai investigated the relationship between CO2 emissions as the dependent variable and GDP per capita, energy consumption, and industrial production as independent variables. Their model revealed a negative relationship between CO2 emissions and GDP per capita, and a positive relationship with energy consumption, while industrial production was not significant at all. They concluded that these relations could help in projecting the policies that protect the environment (Zhigolli & Fetai, 2024).
Obira et al. explored the effect of economic growth on carbon emissions mitigation. They analysed data from 44 countries, including developed, emerging, and developing countries.
Their findings indicated that carbon emissions by the power industry have been mitigated in developed countries, while increased domestic credit to the private sector has increased emissions from the power industry, transport sector, buildings, and other sectors in emerging and developing countries. The authors also stressed that, across all economies, increasing domestic savings will reduce all levels of carbon emissions (Obiora et al., 2021).
Stressing that the hot, arid Middle Eastern countries are among the world's largest energy consumers and emitters of carbon dioxide and greenhouse gases in general, Kouyakhi investigated the driving forces of CO2 emissions in 12 Middle Eastern countries and found that population growth (53.89%), energy intensity (31.97%) and economic growth (18.42%) are the main drivers of CO2 emissions in 12 Middle East countries. They suggested reforming energy subsidies and improving energy efficiency as the most efficient approach (Rajabi Kouyakhi, 2022).
In the case of Arab countries, the CO2 emissions per capita are between 19 and 36 MT in the six GCC countries, between 1 and 9 MT in Algeria, Egypt, Iraq, Jordan, Lebanon, Libya, Morocco, Syria, and Tunisia, and less than 1MT in Comoros, Djibouti, Mauritania, Somalia, Sudan, and Yemen. Coal, fossil fuels, oil, and gas contribute about 90% of CO2 emissions in the Arab region and globally. For example, in Qatar, about 75% of CO2 emissions are driven by gas. In Egypt, it is estimated that more than 250 MT of CO2 are emitted annually from burning fuels and industrial processes, including electricity generation, transport, and heating (Amer et al., 2022).
Gulf Cooperation Council countries with high CO2 emissions use little renewable energy, while a recent study found bidirectional causality between renewable energy and CO2 emissions in Middle Eastern countries. More precisely, it is estimated that a unit increase in renewable energy reduces CO2 emissions by 0.22% (Addis, 2026).
Among Arab and African countries, Morocco (with less than 2 MT of CO2 emissions per capita) is a leader in renewable energy (El Hafdaoui et al., 2024; El Hafdaoui et al., 2025; Berahab et al., 2021; Benbba et al., 2024).
As illustrated in Fig. (1), the PCA reveals a clear distinction between the four variables (EYS, MYS, LEB, and GNI) on the right and the two environmental variables (CO2 and MFP) on the left. Moreover, the six variables are correlated with component 1 (their projections are close to the unit sphere), which will allow for proper interpretation.
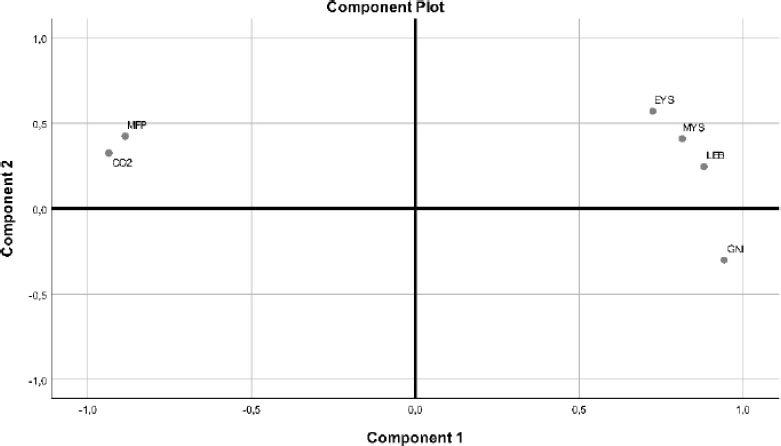
Variables projected on the first plane (Component1xComponent2).
It should be stressed that for statistical validation, the PCA is justified by the values of the Kaiser-Meyer-Olkin (KMO: 0.852) index for the sampling quality and Bartlett's sphericity test (p<0.0001).
3.1.2. Clusters of Countries
3.1.2.1. Axis 1: Axis of Human Development
Associated with the projection of variables on the first plane, the corresponding projection of countries exhibits broadly four clusters: Cluster 1 (Qatar alone) and Cluster 2 (grouping the other five GCC countries) are projected on the right side of the first plane, while the remaining 16 Arab countries are projected on the left side of the first plane, grouped into Cluster 3 and Cluster 4. The third cluster consists of 12 countries belonging to the high development group (Algeria, Egypt, Jordan, Lebanon, Libya, Morocco, Tunisia) and the medium development group (Iraq, Palestine, Comoros) while the fourth cluster includes four countries with low human development (Djibouti, Somalia, Sudan and Yemen) and two countries at the bottom of the medium human development group (Syria and Mauritania).
The first axis also indicates that the extreme countries are Qatar on the right side and Somalia on the left side. This extreme opposition is explained by the fact that Qatar has high scores in LEB, YES, MYS and GNI, combined with low scores in CO2 index and MFP index, while Somalia has the lowest scores in LEB, YES, MYS and GNI, combined with very high scores in CO2 index and MFP index.
The fact that Qatar constitutes a cluster can mainly be explained by its very high per capita income and high CO2 and MFP indices. Indeed, Qatar has a GNI (105353 PPP$) which is more than double that of Saudi Arabia’s GNI and 71.4 times that of Somalia (1475 PPP$). However, it is also the country emitting the highest quantities of CO2 (42.6 tonnes per capita) and MFP (74.1 tonnes per capita) globally and regionally.
Cluster 2 comprises GCC countries (except Qatar), which belong to the very high human development group. These five countries also have high emissions of CO2 and MFP. They are only surpassed by Qatar in terms of planetary pressures.
Cluster 3 is grouping countries with high and medium human development. Except for Libya (emitting 8.9 tonnes of CO2 per capita), the CO2 emission of the nine countries together is 21.3 tonnes per capita, with an average of 2.37 tonnes per capita.
Finally, Cluster 4 is a set of six countries with the lowest HDI in the Arab region (<0.6). Their level of CO2 emission is very low (0.52 tonnes per capita on average).
3.1.2.2. Axis 2: Axis of Planetary Pressures-adjusted Human Development
Conditionally to the information provided by the first axis, the second component brings new interesting information on the impact of CO2 and MFP. Projecting the six GCC countries on the second axis shows that these countries are ranked in descending order: 1. Saudi Arabia, 2. Bahrain, 3. UAE, 4. Oman, 5. Kuwait and 6. Qatar. In fact, this ranking coincides with the PHDI regional ranking of these six countries as indicated in Table 5 (S.A: 7th, Bahrain: 10th, UAE: 13th, Oman: 14th, Kuwait: 17th and Qatar: 22d). Moreover, the PCA illustration of Qatar as an isolated country is a fair translation of its ranking at the bottom of the Arab list, with a very low PHDI score (0.276), nearly 2.5 times lower than Saudi Arabia’s score (0.666) and behind low-income countries like Sudan (0.498), Yemen (0.465) and Somalia (0.396) (Table 5).
| Country | HDI | Global Rank |
Region Rank |
Country | PHDI | Global Rank | Region Rank |
% HDI lost |
|
|---|---|---|---|---|---|---|---|---|---|
| UAE | 0.940 | 15 | 1 | - | Egypt | 0.726 | 46 | 1 | 3.7 |
| S Arabia | 0.900 | 37 | 2 | - | Jordan | 0.714 | 54 | 2 | 5.3 |
| Bahrain | 0.899 | 38 | 3 | - | Algeria | 0.706 | 57 | 3 | 7.5 |
| Qatar | 0.886 | 43 | 4 | - | Tunisia | 0.703 | 59 | 4 | 5.8 |
| Oman | 0.858 | 50 | 5 | - | Lebanon | 0.691 | 61 | 5 | 8.1 |
| Kuwait | 0.852 | 52 | 6 | - | Morocco | 0.679 | 63 | 6 | 4.4 |
| Algeria | 0.763 | 96 | 7 | - | S Arabia | 0.666 | 74 | 7 | 26.0 |
| Egypt | 0.754 | 100 | 8 | - | Iraq | 0.665 | 87 | 8 | 4.3 |
| Jordan | 0.754 | 100 | 8 | - | Palestine | 0.653 | 89 | 8 | 3.1 |
| Lebanon | 0.752 | 102 | 10 | - | Bahrain | 0.632 | 97 | 10 | 29.7 |
| Tunisia | 0.746 | 105 | 11 | - | Libya | 0.629 | 98 | 11 | 12.8 |
| Libya | 0.721 | 115 | 12 | - | Comoros* | 0.603 | 99 | 12 | 3.5 |
| Morocco | 0.710 | 120 | 13 | - | UAE | 0.585 | 110 | 13 | 37.8 |
| Iraq | 0.698 | 126 | 14 | - | Oman | 0.581 | 112 | 14 | 32.3 |
| Palestine | 0.674 | 133 | 15 | - | Syria | 0.553 | 119 | 15 | 2.0 |
| Comoros | 0.603 | 152 | 16 | - | Mauritania | 0.542 | 121 | 16 | 3.7 |
| Syria | 0.564 | 162 | 17 | - | Kuwait | 0.531 | 168 | 17 | 37.7 |
| Mauritania | 0.563 | 163 | 18 | - | Sudan | 0.498 | 176 | 18 | 2.5 |
| Djibouti | 0.513 | 175 | 19 | - | Djibouti | 0.480 | 180 | 19 | 6.4 |
| Sudan | 0.511 | 176 | 20 | - | Yemen | 0.465 | 191 | 20 | 1.1 |
| Yemen | 0.470 | 184 | 21 | - | Somalia | 0.396 | 191 | 21 | 2.0 |
| Somalia | 0.404 | 192 | 22 | - | Qatar | 0.276 | 192 | 22 | 68.8 |
Note: * Estimated because not provided by HDR 2025.
Projection on the second axis also shows that the six countries grouped in Cluster 4 have a PHDI lower than that of the 12 countries in Cluster 3, and especially those with the highest PHDI score (Egypt, Jordan, Algeria, Tunisia, Lebanon, and Morocco).
Interpreting Axis 1 and Axis 2 respectively as axes of Human Development and Planetary pressures-adjusted Human Development is confirmed by a PCA including the variables HDI and PHDI as supplementary variables. In this case, HDI appears highly correlated with Axis 1 (Pearson Correlation: 0.92) while PHDI is very highly correlated with Axis 2 (Pearson Correlation: 0.97).
The graphical results given by PCA in Fig. (2) show clearly that ranking countries only by their HDI score, while ignoring sustainability and environmental effects, yields a potentially misleading ranking. By the way, Togtokh made a similar remark in 2011 when he suggested revising HDI by including each nation’s per capita carbon emissions, stressing that: “The UN goes out of its way to promote sustainable development, yet the Human Development Index (HDI) mostly ignores sustainability. Worse still, the index celebrates gas-guzzling developed nations. It is time that this failure—hidden in plain sight—was exposed and corrected” (Bravo, 2014).
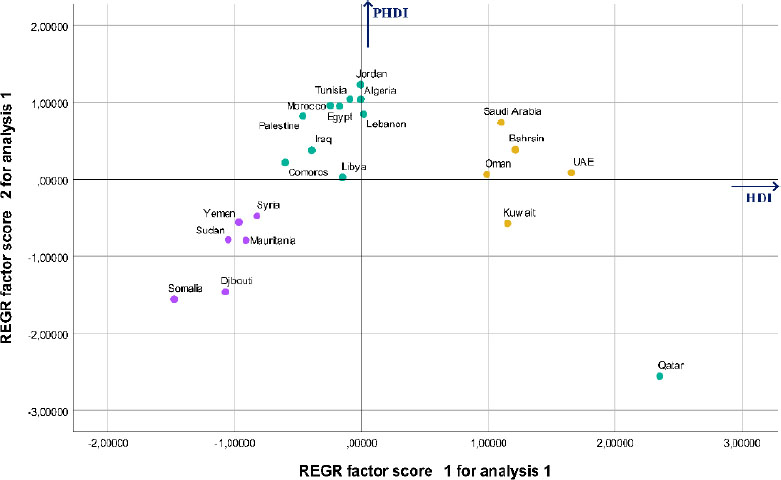
Projection of countries on the first plane (Component1xComponent2).
The quantity of CO2 emitted by the six GCC countries (151.1 tonnes per capita) is more than 4.5 times higher than the quantity emitted by the remaining 16 Arab countries (33.3 tonnes per capita) and the CO2 emitted by Qatar alone (42.6 tonnes) is 1.3 times that emitted by the 16 countries gathered in Cluster 2 and Cluster 3. Huge gaps are also seen in material footprint per capita between Qatar (74.1 tonnes), Kuwait (40.8 tonnes), UAE (39.8 tonnes) and Oman (38.5 tonnes) on the one side and Egypt (3.9), Iraq (3.2), Syria (2.2) and Yemen (1.6) on the other side.
In summary, PCA complements the PHDI ranking by clustering countries based on the effect of socioeconomic and environmental variables instead of a simple ranking.
3.1.3. Qatar as an Outlier Country and Comoros with Missing Data
To address Qatar as an outlier country, a new PCA was run with 21 countries (Qatar excluded), yielding a relative difference in the explained variation of the first two components of less than 5%.
Similarly, although only one value (Comoros' material footprint) was missing, the PCA was run with 21 countries (Comoros excluded), giving a relative difference in the explained variation of the first two components of less than 5%.
3.2. Hierarchical Clustering
To complement the PCA results, a hierarchical clustering method was implemented using the data in Table 2.
As illustrated by Fig. (3), at level 5, the 22 Arab countries are grouped according to 4 clusters, namely: Cluster 1 (Algeria, Comoros, Egypt, Iraq, Jordan, Lebanon, Libya, Morocco, Palestine, Tunisia), Cluster 2 (Djibouti, Mauritania, Somalia, Sudan, Syria, Yemen), Cluster 3 (Bahrain, Kuwait, Oman, Saudi Arabia, UAE) and Cluster 4 (Qatar). This clustering confirms the previous results given by the PCA.
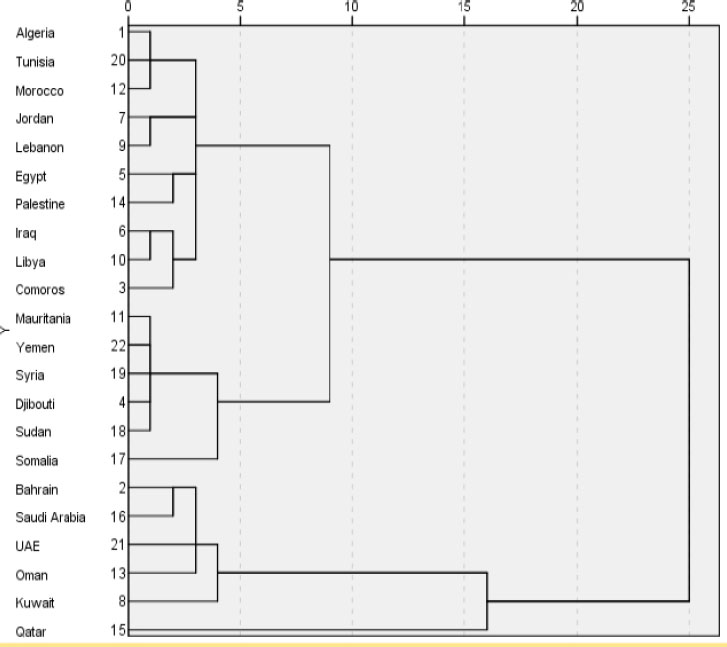
Hierarchical clustering dendrogram.
3.3. Data from Different Sources and other Environmental Indicators
Table 6 summarises the performance of the 22 Arab countries according to five composite indicators computed for large numbers of countries worldwide (Togtokh & Gaffney, 2010; Halpern et al., 2012; Jin et al., 2020; Block et al., 2024; Sachs et al., 2025). It gives the score and the global rank of each Arab country.
| Country |
HSDI 2010 Value Rank |
OHI 2025 Value Rank |
NSDI 2020 Value Rank |
EPI 2024 Value Rank |
SDGI 2025 Value Rank |
|||||
|---|---|---|---|---|---|---|---|---|---|---|
| Algeria | 0.734 | 76 | 65 | 178 | 0.594 | 49 | 41.7 | 114 | 70.1 | 79 |
| Bahrain | 0.719 | 82 | 72 | 100 | 0.342 | 159 | 35.3 | 157 | 64.4 | 110 |
| Comoros | 0.529 | 134 | 80 | 19 | 0.498 | 120 | 38.2 | 137 | 54.7 | 148 |
| Djibouti | 0.504 | 140 | 71 | 124 | NA | NA | 32.3 | 167 | 54.3 | 149 |
| Egypt | 0.692 | 94 | 71 | 123 | 0.449 | 139 | 43.7 | 101 | 68.1 | 91 |
| Iraq | NA | NA | 65 | 181 | 0.456 | 136 | 30.3 | 172 | 63.9 | 113 |
| Jordan | 0.738 | 73 | 66 | 164 | 0.510 | 108 | 47.3 | 77 | 71.0 | 71 |
| Kuwait | 0.685 | 97 | 80 | 24 | 0.326 | 160 | 44.4 | 95 | 63.3 | 118 |
| Lebanon | NA | NA | 45 | 220 | 0.514 | 104 | 39.9 | 126 | 61.7 | 125 |
| Libya | 0.777 | 51 | 54 | 217 | 0.469 | 134 | NA | NA | NA | NA |
| Mauritania | 0.533 | 130 | 69 | 143 | 0.436 | 140 | 34.6 | 159 | 57.9 | 132 |
| Morocco | 0.649 | 109 | 67 | 160 | 0.513 | 105 | 39.5 | 128 | 71.7 | 68 |
| Oman | NA | NA | 77 | 41 | 0.489 | 125 | 51.3 | 55 | 67.1 | 97 |
| Qatar | 0.424 | 151 | 85 | 7 | 0.432 | 141 | 46.8 | 82 | 65.1 | 107 |
| Palestine | NA | NA | NA | NA | NA | NA | NA | NA | NA | NA |
| S. Arabia | 0.748 | 66 | 75 | 54 | 0.390 | 156 | 42.5 | 108 | 65.2 | 105 |
| Somalia | NA | NA | 65 | 177 | NA | NA | NA | NA | 46.1 | 164 |
| Sudan | 0.482 | 147 | 62 | 195 | NA | NA | 39.1 | 131 | 49.1 | 161 |
| Syria | 0.662 | 104 | 47 | 219 | NA | NA | NA | NA | 58.4 | 131 |
| Tunisia | 0.744 | 68 | 63 | 191 | 0.524 | 94 | 45.3 | 91 | 72.0 | 66 |
| UAE | 0.704 | 90 | 86 | 6 | 0.410 | 149 | 51.6 | 53 | 69.8 | 80 |
| Yemen | 0.538 | 217 | 59 | 208 | 0.414 | 146 | NA | NA | 47.7 | 163 |
Abbreviation: NA: not available data.
First of all, it should be noted that the data in Table 6 span a large range of years (2010-2025), and hence one should be careful when comparing countries.
The Human Sustainable Development Index (HSDI 2010) was computed for 163 countries worldwide and yielded scores varying between 0.228 in Zimbabwe (Rank 163) and 0.917 in Norway (Rank 1). For this indicator, Arab countries obtained low scores, varying between 0.777 in Libya (Global rank 51) and 0.424 in Qatar (Global rank 151).
The Ocean Health Index (OHI) measures 10 benefits or goals that people want and need from the ocean. It covers 220 coastal countries and territories. For the 2025 assessment, the global OHI score was 72, still less than the pre-pandemic score of 75. In the Arab region, the best scores were achieved by UAE (86), Qatar (85), Kuwait (80) and Comoros (80), while Lebanon (45), Syria (47), Libya (54), and Yemen (59) had the lowest regional scores. The UAE (global rank 6) and Qatar (global rank 7) were in the top 10 countries worldwide.
The National Sustainable Development Index (NSDI 2020) covered 163 countries and varied from 0.232 in Ivory Coast to 0.747 in Australia. Algeria was ranked 49th and had the best score in the Arab region, followed by Tunisia (0.524, ranked 94th). Weak NSDI scores were associated globally and regionally with GCC countries: Qatar (141st), UAE (149th), Saudi Arabia (156th), Bahrain (159th) and Kuwait (160th).
The Environmental Performance Index (EPI 2024) included 180 countries and showed scores varying between a minimum of 24.6 in Viet Nam and a maximum of 75.7 in Estonia. The median EPI score also varied considerably by region (Table 7). With an EPI score greater than 50, UAE (53th) and Oman (55th) were at the top of the Arab list, while Djibouti (167th) and Iraq (172th) were at the bottom, globally and regionally.
| Country | ESI 2005 | Rank | EPI 2024 | Rank | Region EPI 2024 |
EPI score |
Rank |
|---|---|---|---|---|---|---|---|
| Estonia | 58.2 | 27 | 75.7 | 1 | Global West | 66.9 | 1 |
| Finland | 75.1 | 1 | 73.8 | 4 | Eastern Europe | 59.8 | 2 |
| UK | 50.2 | 66 | 72.6 | 5 | Latin America & Caribbean | 49.2 | 3 |
| Oman | 47.9 | 83 | 51.3 | 55 | Former Soviet States | 45.5 | 4 |
| UAE | 44.6 | 110 | 51.6 | 50 | Asia-Pacific | 42.2 | 5 |
| Egypt | 44.0 | 115 | 43.7 | 101 | Greater Middle-East | 43.1 | 6 |
| Iraq | 33.6 | 143 | 30.3 | 172 | Sub-Saharan Africa | 38.4 | 7 |
| Pakistan | 39.9 | 131 | 25.5 | 179 | Southern Asia | 32.1 | 8 |
| Viet Nam | 42.3 | 127 | 24.6 | 180 | World (180 countries) | 45.5 | - |
Data from different years are used to track countries’ progress rather than to do comparisons (in space and in time) that may lead to inconsistent results. For example, using data (ESI 2005 and EPI 2024) (Table 7), provided by the same teams of Yale University and Columbia University, shows that the environmental performance of the UAE and Iraq (two oil producers) evolved in opposite sides. While the UAE improved its global score and rank from 44.6 (global rank 110) in 2005 to 51.6 (global rank 53) in 2024, Iraq’s global score went down from 33.6 (rank 143) to 30.3 (rank 172) during the same period of time. These results can be explained by the fact that the UAE is the regional leader in wastewater treatment and reuse, and has large networks of protected areas, compared to Iraq with less than 2% of protected land, degraded ecosystems and species facing a high extinction risk (Block et al., 2024).
The Sustainable Development Goals Index (SDGI) measures overall country progress using 17 key indicators, one per SDG, including those directly related to environment like: SDGI6 (% of population using at least basic sanitation services), SDGI7 (% of population with access to electricity), SDGI11 (Annual mean concentration of PM2.5), SDGI12 (Production-based nitrogen emissions per capita), SDGI13 (CO2 emissions from fossil fuel combustion and cement production per capita), SDGI14 (% of mean area that is protected in marine sites), SDGI15 (Red List Index of species survival) (Sachs et al., 2025).
The Sustainable Development Goals Index (SDGI 2025) covered 167 countries and indicated scores varying globally between 41.6 in South Sudan (Rank 167) and 87.0 in Finland (Rank 1). It shows that many Arab countries are not on track to achieve the 17 goals in general and the environmental goals in particular. Most Arab countries are facing challenges in SDG12, SDG13, significant challenges in SDG6, SDG7, SDG11, SDG14 and especially, major challenges in SDG6, SDG7, SDG11, SDG12, SDG13, SDG14 and SDG15 (Table 8).
| Country | SDG6 | SDG7 | SDG11 | SDG12 | SDG13 | SDG14 | SDG15 |
|---|---|---|---|---|---|---|---|
| Algeria | S | M | S | A | S | S | M |
| Bahrain | M | S | M | M | M | M | M |
| Comoros | M | M | S | A | A | M | M |
| Djibouti | M | M | M | S | C | M | M |
| Egypt | S | S | M | C | C | M | M |
| Iraq | S | S | M | C | S | M | M |
| Jordan | S | C | M | C | C | S | M |
| Kuwait | M | S | M | M | M | M | S |
| Lebanon | M | M | S | S | M | M | S |
| Mauritania | M | M | M | C | A | M | M |
| Morocco | S | M | S | C | A | M | M |
| Oman | M | M | M | M | M | S | S |
| Qatar | M | M | S | M | M | S | M |
| Saudi Arabia | S | M | M | M | M | M | M |
| Somalia | M | M | S | A | A | M | M |
| Sudan | M | S | M | C | A | M | M |
| Syria | M | S | M | C | A | M | M |
| Tunisia | S | M | C | C | C | M | M |
| United Arab Emirates | M | S | M | M | M | M | M |
Note: A = Achieved or on track, C = Challenges remain, S = Significant challenges remain, M = Major challenges remain
The Sixth Global Environment Outlook report (GEO-6) released by UNEP in 2016 stressed that West-Asia countries (including 12 Arab countries of the Middle East) were challenged by biodiversity degradation, water stress, solid waste, climate change, clean energy consumption, conservation of marine sources and preservation of terrestrial ecosystems like forests, mountains, dry lands and wetlands (UNEP, 2016). More recently, a report of the FAO revealed that Arab countries (West-Asia and North Africa) were the most affected by water stress in 2021 (Fig. (4)) (FAO & UN-Water, 2024).
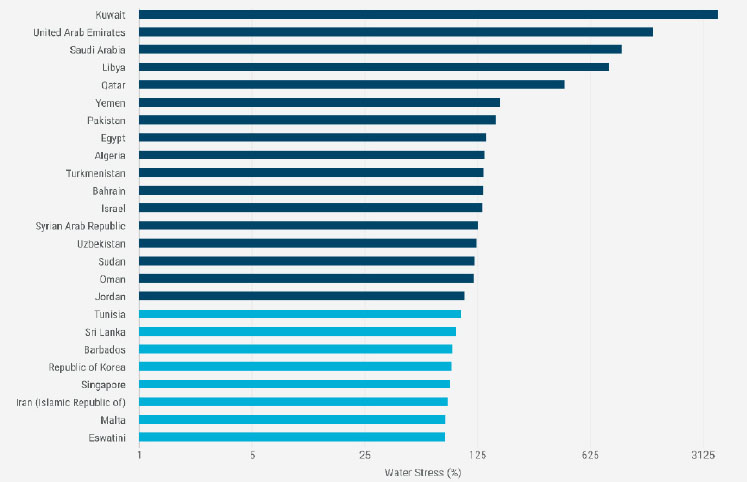
Countries with high and critical water stress levels (water stress level > 75%), 2021.
3.4. The Moroccan Case Study
In 2022, renewable energy sources (wind, solar, hydropower) represented 17.1% of the electricity generation mix in Morocco. Aligning with the global climate commitments and working to achieve SDGs, Moroccan authorities have launched short-term and long-term strategies aimed at reducing CO2 emissions by targeting a high renewable energy share in the electricity mix (52% by 2030 and 70% by 2050). The high solar irradiance in the Moroccan desert (about 2500 kWh/m2/year) and the strong coastal wind reaching an average speed of 8m/s, constitute natural means for the achievement of clean energy innovation and technology transfer (El Hafdaoui et al., 2024; El Hafdaoui et al., 2025; Berahab et al., 2021).
According to the Climate Change Performance Index (CCPI) report 2026, Morocco ranks 6th and is among the highest performers in the CCPI. This high ranking is provided by a high rating in GHG Emissions, Energy Use, and Climate Policy, and a low rating in Renewable Energy. The CCPI estimates GHG (Greenhouse Gas Emissions) in 63 countries and the European Union, which together contribute to more than 90% of global greenhouse gas emissions. The CCPI uses 14 indicators covering Greenhouse Gas Emissions (40% of the overall score), Climate Policy (20%), Energy Use (20%), and Renewable Energy (20%) (Climate Change Performance Index, 2025).
In 2025, Morocco had access to a high human development level (global rank 120th) and achieved the second best SDGI score in the Arab region (global rank 68th).
4. LIMITATIONS
This study had limitations such as missing data, a large range and heterogeneity of data (2005-2025), and use of secondary data.
CONCLUSION AND PERSPECTIVES
The analysis undertaken in this paper shows that Arab countries perform differently in terms of environmental indicators. Environmental issues are particularly affecting human development in rich countries of the Gulf. The six GCC countries are losing a large proportion of their HDI due to planetary pressures and hence, sliding seriously down in HDI ranking, with Qatar ranked last of the 193 countries for which PHDI was calculated in 2025.
However, all Arab countries are challenged by different environmental issues such as biodiversity loss; water stress and deteriorating water quality; persistent overexploitation of groundwater resources; unsustainable consumption patterns threatening water, energy and food security; air pollution; waste management; energy efficiency; and lack of peace and security in countries under devastating conflicts.
Despite the commitment of GCC developed countries to boosting the proportion of renewable energy in their overall energy mix, they rely heavily on fossil fuels, and consequently, they remain among the world's largest energy consumers and emitters of carbon dioxide and greenhouse gases (Rajabi Kouyakhi, 2022; Elrahmani et al., 2021). In contrast, developing countries like Morocco are investing seriously in renewable energy, and hence, they are reducing their CO2 emissions and greenhouse gases in general.
Although the gross national income per capita is one of the main three components involved in calculating the usual HDI, this study shows that adding planetary pressures as a fourth component yields a PHDI that is more respectful of sustainable development and its three components (economic growth, social inclusion, and environmental protection), seeking the well-being of societies and individuals of present and future generations.
As a perspective, the authors will work on a “Sustainable Human Equitable Development Index” (SHEDI) as soon as sufficient data are available both on the environment and inequality in all Arab countries.
AUTHORS’ CONTRIBUTIONS
The authors confirm their contributions to the paper as follows: A.B.: Contributed to the research design, draft writing, and reference checking. M.L.E.N.: Contributed to the research design, simulations, figure plotting, and text editing. W.B.: Contributed to the research design, data and parameters checking, and draft revision. All authors reviewed the results and approved the final version of the manuscript.
AVAILABILITY OF DATA AND MATERIALS
The data supporting the findings of the article is available in the [Human Development Report 2025] at [https://hdr.undp.org/content/human-development-report-2025], reference number [Human Development Report 2025: A matter of choice: People and possibilities in the age of AI. Available from: https://hdr.undp.org/content /human-development-report-2025].
ACKNOWLEDGEMENTS
The authors are grateful to Pr. Khaloua Naoual (PhD and Professor in English at ESEFO-UMP) for reading and checking English editing.

