All published articles of this journal are available on ScienceDirect.

Remediating Naturally Occurring Radioactive Materials and Other Contaminants in Groundwater Using Locally Prepared Activated Charcoal
Authors Info & Affiliations
Abstract
Introduction
Most rural and peri-urban inhabitants in Ghana obtain their drinking water primarily from groundwater. However, groundwater quality is threatened by the presence of pollutants, including toxic metals, naturally occurring radioactive materials, hydrocarbons, trace organic contaminants, pesticides, nanoparticles, microplastics, and other emerging contaminants, posing risks to human health, ecological systems, and sustainable socioeconomic development.
Methods
This study evaluated groundwater quality using chemical and radiological analyses. In addition, a locally produced material (activated charcoal) was developed and tested for the removal of chemical and radiological contaminants from groundwater.
Results
Groundwater in Teiman, Ghana, showed Rn-222 concentrations ranging from 1 to 35 Bq L−1 (mean: 8.4 ± 6.1 Bq L−1), with 19% of samples exceeding the USEPA limit of 11 Bq L−1. Activated charcoal reduced Rn-222 concentrations by 71–98% (mean: 89 ± 8%). The mean pre-treatment ingestion and inhalation doses were 21.5 µSv yr−1 and 17 µSv yr−1, respectively, and were reduced after treatment. Other NORMs included Ra-226 (0.08–0.81 Bq L−1), Ra-228 (0.05–0.62 Bq L−1), and Th-232 (0.03–0.58 Bq L−1). Annual effective doses ranged from 0.06 to 0.26 µSv yr−1 (ingestion) and from 0.26 to 1.15 µSv yr−1 (inhalation), which were below the WHO guideline value of 0.1 mSv yr−1 but still warrant reduction. Locally prepared CaCl2-activated charcoal derived from coconut husk reduced Ra-226 and Ra-228 by 71 ± 9%, Th-232 by 58 ± 11%, EC and TDS by approximately 42%, and cation and anion concentrations by 54–92%. The pH increased from 6.2 ± 0.4 to 7.5 ± 0.3, which falls within the WHO recommended range of 6.5–8.5.
Discussion
The results showed varying percentage reductions in the physicochemical parameters and radionuclide activity concentrations studied. Activated charcoal prepared from coconut husk demonstrated significant potential for removing chemical and radiological contaminants from groundwater.
Conclusion
Activated charcoal prepared from coconut husk demonstrated significant potential for removing chemical and radiological contaminants from groundwater. The low-cost filter is scalable for use in rural communities.
1. INTRODUCTION
The safety of the public's drinking water is of utmost importance. Access to safe drinking water remains a major challenge despite progress made in recent decades. Approximately 10% of the global population lacks access to improved drinking water sources, as reported by the World Health Organization (WHO). Many nations have laws and programs in place to ensure safe drinking water; however, as more knowledge becomes available, the criteria and guidelines for both known and emerging contaminants are being frequently revised (Levallois and Villanueva, 2019). Water is used extensively in our daily lives, both domestically and industrially. It is essential to human health as well as the health of ecosystems, which form the foundation for economic prosperity.
Groundwater has historically been extracted by humans, particularly in arid regions where surface water is typically scarce. Aquifers are being tapped worldwide, and more than 1.5 billion people rely on groundwater as their primary source of drinking water (Ganyaglo et al., 2010). Access to treated water is insufficient, if not nonexistent, in many communities. As a result, people are increasingly turning to drilling boreholes or digging wells to meet their water needs. Several factors influence groundwater quality, including geology, the extent of chemical weathering of different rock types, the quality of recharge water, and water–rock interactions (Ayenew, 2008; Yidana et al., 2008; Guler and Thyne, 2004; and Manu et al., 2023).
One of the most important factors in a country's long-term prosperity is ensuring that its citizens have access to clean drinking water.
The hydrochemistry of groundwater is crucial in determining its potability. Because of its widespread use, groundwater quality has become a matter of public concern. Both natural and anthropogenic processes, as well as factors such as recharge quality, groundwater flow velocity, and dissolved salts, can affect the physical and chemical characteristics of water (Acquah et al., 2025; Manu et al., 2023; and Ayeta et al., 2024). According to research by Sunkari et al. (2025), about 30% of Ghana's boreholes have excessive iron concentrations. Iron is abundant in borehole water due to the geological formations underlying the area.
Many of Ghana's hand-dug wells are contaminated with nitrates and coliform bacteria, making the water unfit for human consumption (Acquah et al., 2025). The WHO (2017) has provided criteria for evaluating groundwater quality. Examples of such parameters include electrical conductivity (EC), pH, salinity, alkalinity, total dissolved solids (TDS), Ca2+, Mg2+, K+, Na+, Cl−, SO42−, NO2−, NO3−, and PO43−. By studying hydrogeochemical characteristics and groundwater quality, it is possible to determine how human activities at the Earth's surface affect groundwater quality (Sunkari et al., 2025; and Yidana et al., 2008). For instance, soil's capacity to absorb water is affected by factors such as salinity and osmotic pressure in areas with high salinity levels (WHO, 2017).
The quality of the water supply is crucial to the well-being of any community. Many human activities depend on the availability of clean water. An adequate, safe, and accessible water supply is essential for human survival. Safe drinking water, as defined by WHO guidelines, poses no significant health risk over a lifetime of consumption, taking into account the various sensitivities that may arise at different stages of life (WHO, 2017).
Recently, radiological contamination, which has hitherto received limited attention, has attracted increasing public concern because of its potential impact on human health. Radioactive isotopes often release their excess energy in the form of ionizing radiation. Each radionuclide has a unique emission probability, which is typically expressed as a function of its half-life. A radionuclide's half-life is the amount of time required for its activity to decrease by half. These radionuclides are commonly found in rocks and, because of their solubility, can contaminate groundwater. Chemical and radioactive pollutants are among the most common contaminants in groundwater used for human consumption. Natural radioactive elements are more closely associated with geological features than their anthropogenic counterparts.
The predominant naturally occurring radionuclides in water are uranium and radium. Significant concentrations of uranium and radium have been consistently detected in groundwater in Norway, Finland, and Germany (Frengstad et al., 2000; and WHO, 2004). Granitic and metamorphic rocks, such as gneisses, black shales, and phosphate rocks, may contain significant quantities of radionuclides belonging to natural radioactive decay series.
Laboratory analyses of water–rock interactions have shown that water in direct contact with granite may contain elevated uranium concentrations (Bonotto et al., 2001). It has also been confirmed in several geological settings that highly radioactive soils are correlated with elevated radionuclide activities in water. Dvorzhak et al. (2025) and Karim et al. (2020) found that this correlation was particularly strong in groundwater. Regular consumption of radon-contaminated water may also increase the risk of cancer, particularly stomach cancer. According to a report by the National Academy of Sciences, the United States Environmental Protection Agency (EPA) estimates that 168 cancer deaths occur annually as a result of radon in drinking water. Specifically, 89% of these deaths are attributed to lung cancer caused by inhalation of radon released into indoor air from water, while 11% are attributed to stomach cancer. The continuous migration of radon from the Earth's crust into groundwater remains a concern (National Research Council, 1999). The higher the concentration of radon and the longer the duration of exposure, the greater the risk of developing lung cancer. The United States Environmental Protection Agency estimates that radon-related lung cancer causes approximately 21,000 deaths annually.
The major types of pollutants found in groundwater used for human consumption are chemical, biological, and radioactive contaminants. Conventional drinking water treatment processes effectively remove most biological and chemical contaminants but may not adequately remove radioactive substances from water. Radionuclides can originate from both geogenic and anthropogenic sources, with the former being closely associated with geological features. Teiman, a peri-urban area located at the base of the Akwapim mountain range, where most groundwater recharge occurs, may present a significant risk to populations that rely on hand-dug wells and boreholes for drinking water.
Boreholes drilled into bedrock containing uranium and its decay products may become contaminated with naturally occurring radioactive materials. Available treatment options are often expensive; consequently, many communities consume the water without any form of treatment. This may lead to serious health problems that can negatively affect productivity. The overall objective of this study is to investigate the efficiency of locally prepared activated charcoal derived from coconut husk in reducing radionuclide concentrations and chemical contamination in groundwater. The development of locally sourced materials for groundwater treatment can help reduce water treatment costs and improve access to potable water. Increased access to potable water can enhance productivity, improve school attendance, and promote educational consistency among children.
2. MATERIALS AND METHODS
2.1. Study Area Description
The study was carried out in Teiman, a small town with a population of approximately 44,194, located in the La-Nkwantanang Madina Municipality of the Greater Accra Region. It lies adjacent to the southern end of the Akwapim–Togo Range and is situated about 22 km north of Accra. Teiman is located northeast of Abokobi and northwest of Oyarifa. The town is situated at latitude 5°45′0″ N and longitude 0°11′0″ W.
The area is underlain by Precambrian rocks of the Dahomeyan Formation, consisting mainly of granite, gneiss, and schist. Sandy and loamy soils are common in the area (Dickson and Benneh, 1995). Teiman experiences a tropical climate with two rainy seasons: May–July (700 mm) and September–October (770 mm). Sampling was conducted in May 2022 (wet season) and October 2022 (dry season). Ten wells with high radionuclide activity were resampled during the dry season to assess seasonal variation, as shown in Table S1. A paired t-test showed no significant seasonal difference (p = 0.21).
2.2. Materials
2.2.1. Fieldwork or Sampling
Twenty-seven (27) samples of water were collected from nine wells and eighteen boreholes randomly situated as shown in Fig. (1).
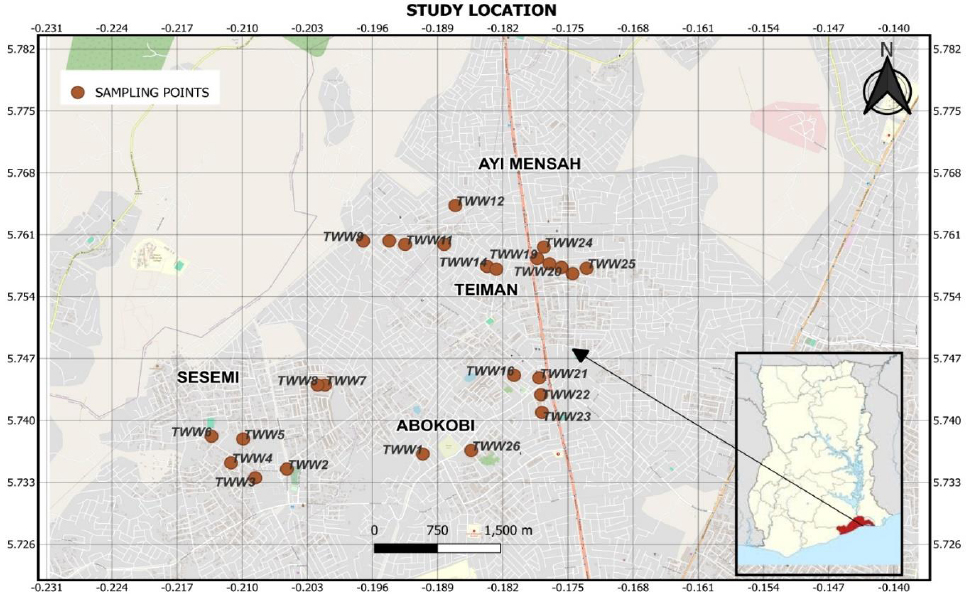
Geographical map and sampling points (n = 27).
Samples for physicochemical analyses were collected using 500 mL high-density polyethylene (HDPE) containers. For radon analysis, 68 mL sampling vials with Teflon® gasket screw tops were used. One-litre (1 L) bottles were used for the collection of samples intended for gamma spectrometry analysis. All sample containers were thoroughly cleaned using soap and water. The high-density polyethylene (HDPE) bottles were treated with 10% HNO3 at ambient temperature for three days following a two-day immersion in a Way-Am liquid soap bath.
The bottles were then thoroughly rinsed with deionized water and subsequently dried overnight at 60°C in a controlled oven environment. After drying, the bottles were removed from the oven, allowed to cool, and double-wrapped in resealable plastic bags before being securely sealed (McDonald et al., 1998).
Twenty-seven groundwater samples were collected in May 2022 from various sampling locations, as shown in Fig. (1). The groundwater samples were obtained from hand-dug wells and boreholes used by residents for domestic water supply in and around their homes.
A volume of water was purged before sample collection to remove stagnant water and ensure that fresh aquifer water was collected for analysis (Snoeyink and Jenkins, 1980).
For radon, other radionuclides (Ra-226, Ra-228, Th-228, and Th-232), and physicochemical analyses, three (3) sets of duplicate samples were collected. Immediately after collection, samples intended for radium, thorium, and cation analyses were acidified in the field with two drops of concentrated 65% nitric acid (HNO3). This was done to prevent hydrolysis and minimize radionuclide and ion adsorption onto the inner walls of the sample containers. The sample vials were sealed underwater using a submerged collection technique to prevent the formation of air pockets and the accumulation of carbon dioxide.
The temperature, electrical conductivity (EC), total dissolved solids (TDS), salinity, and pH of each sample were measured using the H198129 portable water quality test kit. The pH probe was rinsed with distilled water between measurements before data collection. The date and time of sample collection were clearly recorded on the labels of all sampling vials. The samples were transported in ice chests to maintain field temperature and delivered to the Ghana Atomic Energy Commission Laboratories for preparation, storage, and analysis. The GPS coordinates of each sampling location were also recorded.
3. METHODS
3.1. Preparation and Characterization of Activated Charcoal
A coconut husk was obtained from local coconut vendors, washed with distilled water, and solar-dried for three days. The sample was then cut into small pieces, weighed, and carbonized at 300°C for 1 hour using a Lindberg Sola Basic Oven. After carbonization, the sample was cooled, ground into powder, and sieved through a 224 µm mesh to obtain uniformly sized charcoal granules. The resulting sample was placed in zip-lock bags and stored.
A total of 300 g of calcium chloride (activator) was weighed using a Sartorius Entris® 224-1S balance (accuracy ± 0.1 mg) and dissolved in 900 mL of water (1:3 ratio). The solution was stirred using a magnetic stirrer to facilitate dissolution. The charcoal sample was then added to the calcium chloride solution in a glass jar and stirred thoroughly to form a paste. The mixture was tightly covered with a metal lid and left undisturbed for 24 hours (Verla et al., 2012; and Darko et al., 2010).
The impregnated charcoal was subsequently filtered using grade 90 cheesecloth and dried in a Lindberg Sola Basic Oven at 200°C for 2 hours. The dried sample was then crushed to break up any lumps, sieved through a 224 µm mesh, and stored in tightly sealed glass bottles.
3.2. Textural Properties, Weight, and Bulk Test
First, the weighing balance was zeroed using a 50 mL measuring cylinder. The cylinder was filled to the 50 mL mark with lump-free activated charcoal. To ensure that no void spaces were present, the measuring cylinder was lightly tapped. The mass was then determined and recorded. Eq. (1) was used to calculate the bulk density.
Where: ρb is bulk density (g/cm3), m is the mass of activated charcoal (g), V is the volume occupied (cm3, here 50 mL = 50 cm3).
3.3. Degree of Burn-off
The degree of activated charcoal burn-off was calculated through Eq. (2).
Where: Wi is the initial mass of the coconut husk sample (g), and Wf is the mass of the sample after being subjected to activation (g).
Degree of burn-off = 48.2 ± 3.1% (microporous structure) (Veerabhadra et al., 2023 and Nasir and Shah, 2012)
3.4. Determination of pH
The pH of the prepared activated carbon was determined as follows: 100 mL of water and 5.0 g of charcoal were placed in a 250 mL beaker. The mixture was heated to boiling for 5 minutes. The liquid was then decanted and allowed to cool to room temperature. The pH was subsequently measured and recorded.
3.5. Iodine Number Determination
An approximate indication of the porosity of activated carbon is the iodine number (IN). It is a measure of the activated charcoal’s microporosity, with pore sizes as small as 2 nm. It is calculated using the ASTM D4607-94 procedure (Ayeta et al., 2024; and Zobel, 2025). The ASTM D4607-94 method was modified in this study to determine the iodine number. The activated carbon sample was treated with 10 mL of 5% HCl during the experimental procedure. Following a 30-second boiling period, the sample was cooled to room temperature. The mixture was then treated with 100 mL of 0.1 N (0.1 mol L−1) iodine solution and agitated for 30 seconds. After filtration of the resulting mixture, 10 mL of the filtrate was titrated with a 0.1 N (0.1 mol L−1) sodium thiosulphate solution using a starch indicator. The iodine number was 912 ± 22 mg g−1.
3.6. Filtration of Water Samples
An activated carbon water filter was constructed using a 2.5 cm × 30 cm glass column packed with 15 cm activated carbon (particle size 0.5 - 1.0 mm) and 5 cm quartz sand (1 - 2 mm). Each 500 mL sample was filtered through 20 g of charcoal in triplicate at a flow rate of 2 mL s−1 (empty-bed contact time = 7.5 min). The column was rinsed with 2 bed volumes of deionized water before use. Breakthrough >95% removal up to 150 bed volumes was achieved.
For a detailed investigation of the removal of common cations and anions, five groundwater samples (TWB14, TWB23, TWB24, TWB25, and TWB26) were deliberately selected to represent the range of initial TDS (320 - 780 mg/L) and hardness encountered in the full set of 27 samples (25th-90th percentile). These samples were treated in triplicate under identical column conditions as the radon-high samples.
4. EXPERIMENTAL
4.1. Instrumentation and Analysis for Radon
An electret was loaded into an S Chamber, and the initial voltage was measured. A glass measuring jar was placed horizontally on its side, with the lid, sealing collar, and screwdriver kept within reach. The sampling bottle cap was opened and inserted into the jar’s clip, and the E-PERM was suspended from the inside of the cap. The jar was then raised to an upright position, and the cover was tightened to prevent radon leakage. The radon analysis was conducted on an upper floor to minimize residual radon in the measuring jar. A rubber sealing collar was attached around the white cap, and the clamp was tightened using a screwdriver. The start date and time of the test were recorded. The jar was gently shaken to accelerate radon release. It was then stored in a vertical position for three days. After the exposure period, the clamp was loosened and the collar was removed. The E-PERM was removed by unscrewing the lid, and the final voltage was measured. The start and end dates and times of the test were entered into an Excel sheet.
4.2. Instrumentation and Analysis for Other Radionuclides
A high-purity germanium gamma detector was used. Before analysis, energy and efficiency calibrations were conducted to obtain both qualitative and quantitative results from the analyzed samples. The calibration utilized established test sources and mixed radionuclide standards to ensure precise energy and efficiency measurements.
For efficiency calibration, the IAEA reference materials IAEA-RGK-1 (K-ore), IAEA-RGU-1 (U-ore), and IAEA-RGTh-1 (Th-ore) were counted for 24 hours. The resulting spectra were obtained and analyzed to determine peak areas for further evaluation. Net counts were calculated by subtracting background counts from the gross peak area (Otton, 1994; and Dvorzhak et al., 2025). The system has a resolution of 1.96 keV for Co-60 at 1332 keV and a relative efficiency of 42.6%. The sample geometry was 1 L Marinelli. Peak ROI was set at ±1.5 FWHM, with background defined as 50 channels on each side.
Genie-2000 Gamma-Ray Acquisition and Analysis Software was used to identify radionuclides present in the samples based on their characteristic gamma energies. Natural radionuclides Ra-226, Th-232, and K-40 were identified for each sample. Since Ra-226 and its progeny account for 98.5% of the radiological impact of the uranium series in nature, their precursors were disregarded. As a result, Ra-226, rather than U-238, was used as the reference for the U-238 series. The counting duration was sufficient to determine energy reference lines as well as the minimum detectable activities (MDA), which were 0.4, 1.1, and 1.4 Bq/kg for Ra-226, Th-232, and K-40, respectively.
The activity concentration of Ra-226 was determined using gamma-ray energies of 351.9 keV (36.6%) and 295.2 keV (18.5%) from Pb-214 decay, as well as 609.3 keV (46.1%) and 1120 keV (15%) from Bi-214 decay. Gamma emissions of 911.1 keV (29%) from Ac-228 decay, 583.1 keV (84.5%) from Tl-208 decay, and 238.6 keV (43.6%) from Pb-212 decay were used to determine Th-232 activity concentration. The 1460.9 keV gamma energy was used to determine K-40 activity concentration, with an emission probability of 10.67%. Samples were counted using the same geometry as the calibration standards and for the same counting duration (Darko et al., 2010).
4.3. Calculation of Concentration of Radon in Water
The concentration of radon in the analyzed hand-dug well and borehole water was computed using Eq. (3).
where; RnC is the radon concentration (pCi L-1), Vi is the initial electret voltage (V), Vf is the final electret voltage (V), D is the exposure period (days), CF is the calibration factor (0.057 pCi L-1 V-1 d-1), BG is the background gamma dose rate (0.12 µSv h−1, converted to consistent units for subtraction; note: BG × D yields pCi/L equivalent via calibration). Radon concentrations were converted to Bq/L using the factor 1 pCi/L = 0.037 Bq/L for reporting and dose calculations (Nasir and Shah, 2012; Kpordzro et al., 2022, and Opoku-Ntim, 2019).
4.4. Annual Effective Dose due to Ingestion
The annual effective dose resulting from the ingestion of radon from (Hing) was determined using Eq. (4) (Verla et al., 2012; Veerabhadra et al., 2023 and Darko et al, 2010).
Where: Hing is the annual effective dose from ingestion (mSv/yr), CRn is the radon concentration in water (Bq/L). Ding is the conversion factor, quantified as 3.5 × 10⁻⁹ SvBq-1, while L is the annual water ingestion rate (730 L yr-1, based on 2 L in a day for adults) (ICRP, 2017 and European Council Directive, 2013).
4.5. Annual Effective Dose due to Inhalation
The annual effective dose from radon inhalation (Hinh), attributed to the radon concentration in drinking water, was determined using Eq. (5).
Where: Hinh is the annual effective dose from inhalation (mSv/yr), CRn is the radon concentration in water (Bq/L = Bq m−3/1000), Raw is the air-water transfer ratio (10−4), O is the occupancy factor (0.8 for indoor exposure), F is the equilibrium factor (0.4), T is the annual exposure time (7000 h/yr; corrected from 8670 h/yr to align with UNSCEAR residential averages), DCinh is the dose conversion factor (9 × 10⁻⁹ Sv/(Bq h m−3)) (ICRP, 2017).
4.6. Activity Concentration of other Radionuclides
The activity concentration of the radionuclides was calculated using the formula Eq. (6).
Where: Ac is the activity concentration (Bq/L), Ns is the net sample count rate (cps), Nb is the net background count rate (cps), P is the gamma emission probability (dimensionless), Tc is the counting time (s), E is the efficiency of the detector (dimensionless), and V is the sample volume (L).
5. RESULTS AND DISCUSSION
All analyses were performed in triplicate, and the results for each sample were averaged (n = 3 per sample). Data normality was confirmed for all parameters using the Shapiro–Wilk test (p > 0.05 in all cases). Outliers were identified and excluded using Grubbs’ test (α = 0.05), resulting in the removal of two outliers across all datasets. Comparisons were performed using paired t-tests, with statistically significant reductions indicated by p < 0.01. Measurement uncertainty was estimated at ±5%, based on the combined precision of the instruments (analytical balance ±0.1 mg, detector efficiency ±1.5%, and relative standard deviation of triplicates <3%). The 95% confidence interval was calculated as the mean.
The results of the physicochemical parameters, radon, radium, and thorium concentrations, as well as the impact of activated charcoal made from local agricultural waste (coconut husk) on these parameters, are presented. The data obtained after filtering the samples were compared, where necessary, to the standards and recommendations established by Marton et al. (2006; and Shrestha et al., 2018).
5.1. Electrical Conductivity and Total Dissolved Solids
The electrical conductivity (EC) and total dissolved solids (TDS) of five selected samples were observed to decrease after treatment with the prepared activated charcoal. The EC values decreased by a mean percentage of 41.6 ± 4.2%, and the TDS values decreased by 41.6 ± 4.1%. Figure 2 shows the initial and final EC and TDS values.
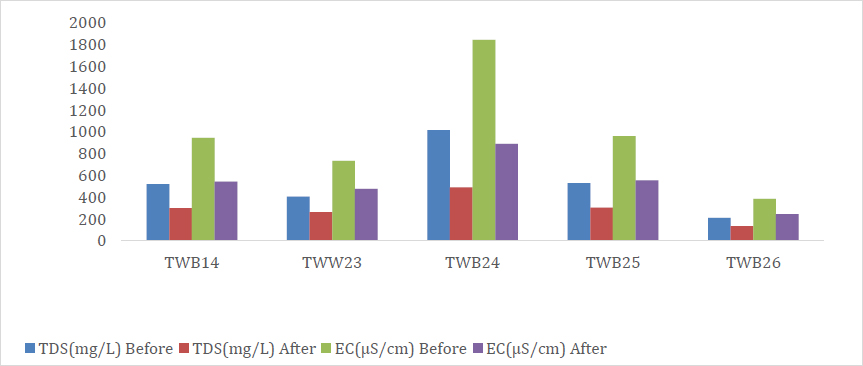
Comparison of Initial and Final EC and TDS values: Dark yellow and violet color representing EC (µs cm-1) before and after treatment.
5.2. Salinity and pH
The salinity of the selected samples decreased after treatment with the prepared activated charcoal. Salinity was reduced by a mean of 59.1 ± 6.3%. While other parameters decreased, the pH of the samples increased by a mean percentage of 21.5 ± 3.1% (from 6.2 ± 0.4 to 7.5 ± 0.3). The increase in pH is due to the activating agent (CaCl2), which is basic. The final pH complies with WHO guidelines (6.5–8.5) (Lahav, 2007). The taste panel (n = 10) reported a “neutral” taste. No scale deposition was observed after 30 days. Leaching results showed Ca2+ < 0.1 mg L−1 and Cl− < 0.05 mg L−1 (empty column control). Figure 3 shows the initial and post-treatment values of salinity and pH.
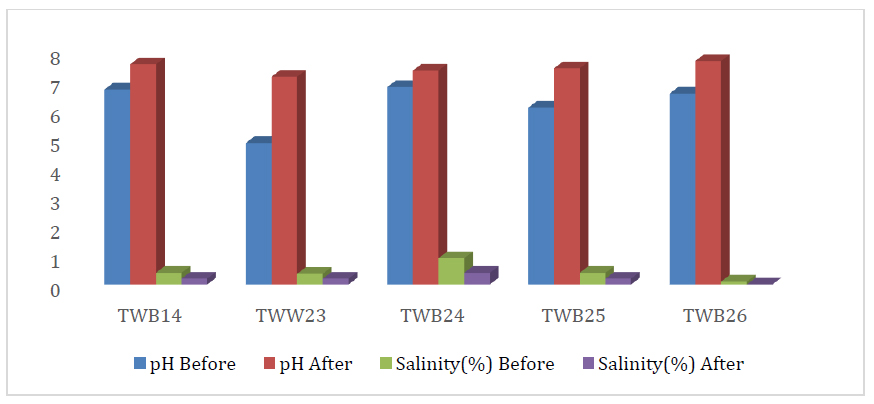
The initial and after treatment values of salinity and pH.
5.3. Chemical Parameters (Cations)
From the results, it was observed that the activated charcoal had the desired effect on the cation concentrations of the treated water samples. The percentage removal was calculated using the equation: % Removal = 100 × (C0 − Cₜ) / C0. Ca2+ had a mean percent removal of 91.9 ± 4.6%, K+ 63.4 ± 3.2%, Mg2+ 61.7 ± 3.1%, and Na+ had a mean percent removal of 54.6 ± 2.7%, as shown in Table 1.
| Sample ID | Ca2+ CBT (mg/L) | Ca2+ CAT (mg/L) | Removal (%) | Mg2+ CBT | Mg2+ CAT | Removal (%) | Na+ CBT | Na+ CAT | Removal (%) | K+ CBT | K+ CAT | Removal (%) |
|---|---|---|---|---|---|---|---|---|---|---|---|---|
| TWB14 | 98.4 | 7.2 | 92.7 | 32.1 | 11.8 | 63.2 | 48.6 | 23.1 | 52.5 | 12.4 | 4.5 | 63.7 |
| TWB23 | 112.4 | 9.1 | 91.9 | 38.2 | 14.9 | 61.0 | 56.2 | 25.8 | 54.1 | 15.1 | 5.6 | 62.9 |
| TWB24 | 87.6 | 6.8 | 92.2 | 28.9 | 10.7 | 63.0 | 42.3 | 18.9 | 55.3 | 11.8 | 4.3 | 63.6 |
| TWB25 | 76.5 | 7.9 | 89.7 | 25.4 | 10.2 | 59.8 | 38.7 | 18.2 | 53.0 | 10.9 | 4.1 | 62.4 |
| TWB26 | 105.2 | 8.4 | 92.0 | 35.6 | 13.5 | 62.1 | 52.1 | 23.7 | 54.5 | 14.2 | 5.2 | 63.4 |
| Mean ± SD | 96.0±3.4 | 7.9±0.9 | 91.7±1.2 | 32.0±2.1 | 12.2±1.3 | 61.8±1.4 | 47.6±2.5 | 21.9±1.7 | 53.9±1.2 | 12.9±1.2 | 4.7±0.8 | 63.2±0.5 |
| p-value (paired t-test) | <0.001 | <0.01 | <0.01 | <0.01 |
5.4. Chemical Parameters (Anions)
From Table 2, it can be observed that the prepared charcoal had the desired effect on the anion concentrations of the treated samples. The anion with the highest removal efficiency is nitrate, followed by sulphate, and chlorine is the least removed ion.
| Sample ID | Cl- CBT (mg/L) |
Cl- CAT (mg/L) |
Removal (%) | SO42-CBT | SO42- CAT | Removal (%) | NO3-CBT | NO3- CAT | Removal (%) |
|---|---|---|---|---|---|---|---|---|---|
| TWB14 | 68.4 | 48.1 | 29.7 | 112.3 | 34.2 | 69.6 | 28.9 | 4.1 | 85.8 |
| TWB23 | 82.1 | 56.8 | 30.8 | 138.7 | 41.9 | 69.8 | 32.4 | 4.8 | 85.2 |
| TWB24 | 59.3 | 40.6 | 31.5 | 98.5 | 31.1 | 68.4 | 24.6 | 3.9 | 84.1 |
| TWB25 | 54.7 | 36.9 | 32.5 | 89.4 | 28.8 | 67.8 | 21.8 | 3.5 | 83.9 |
| TWB26 | 76.5 | 51.2 | 33.1 | 125.6 | 37.4 | 70.2 | 30.1 | 4.4 | 85.4 |
| Mean ± SD | 68.2±3.2 | 46.7±2.7 | 31.5±1.4 | 112.9±4.2 | 34.7±2.2 | 69.2±1.0 | 27.6±2.0 | 4.1±0.7 | 84.9±0.8 |
| p-value (paired t-test) | - | - | <0.05 | - | - | <0.01 | - | - | <0.001 |
Figure 4 shows the average percentage removal of the physicochemical parameters from the groundwater in the study area by the prepared activated charcoal. It indicates that the chloride ion is the least removable compared to the magnesium ion.
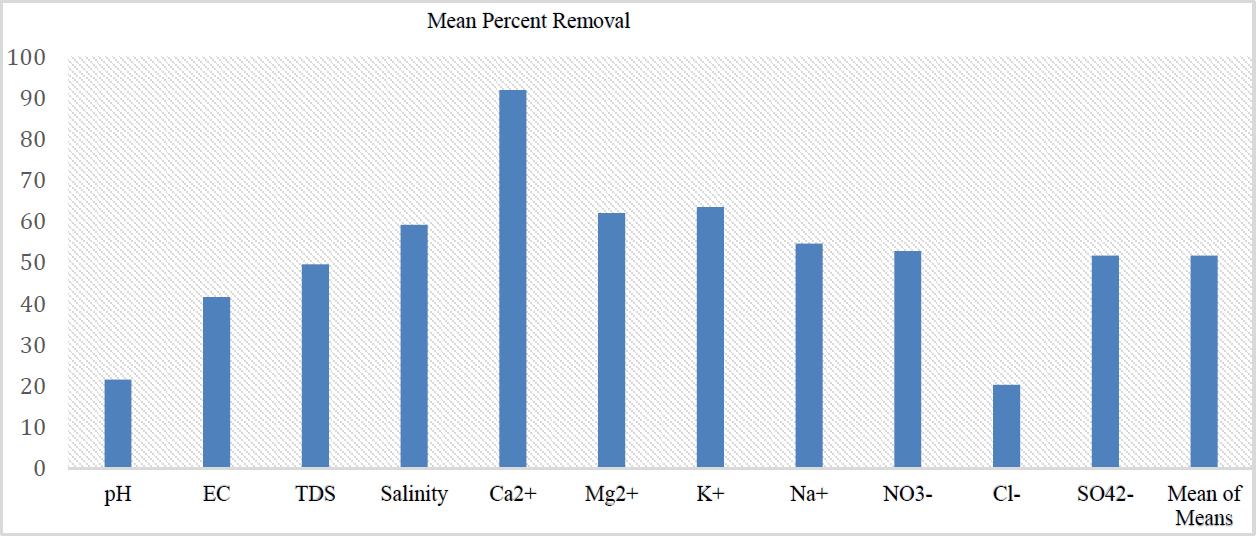
Comparison of average percentage removal efficiency of the physicochemical parameters.
5.5. Radionuclides
The type of rock, groundwater depth, and seasonal variations all significantly affect radon levels in the water.
The radon concentration in the study area ranged from 1 Bq/L to 35 Bq/L. Twenty (20) sampling points representing 76.92% had values below the standard of 11 Bq/L, and five (5) sampling points (19%) had values above the USEPA standard and required remediation (Ghana Standard Authority, 2009; WHO, 2004).
This study recorded relatively high radon concentration values compared to a similar study carried out at Obuasi and Offinso, which are mining areas, and to a study by Darko et al. (2010) in the Dome Kwabenya enclave. The study recorded 0.47 Bq/L and 0.42 Bq/L as its highest values in the dry and rainy seasons, respectively. The seasonal average was found to be 0.08 Bq/L and 0.14 Bq/L, respectively, for Obuasi and Offinso. Similarly, a study carried out by Shikha et al. (2018) in Dhaka city, Bangladesh, reported a mean radon concentration of 7.13 Bq/L, which is lower than the present study’s mean value of 8.4 ± 6.1 Bq/L.
These relatively high radon concentration values may be due to the location of the study area, situated at the foot of the Akuapim Ridge, and the underlying rocks, which are predominantly Precambrian rocks of the Dahomeyan Formation. The rocks are metamorphic in nature and consist mainly of granite, gneiss, and schist. The mean annual effective dose due to ingestion and inhalation was determined to be 21.5 µSv/yr and 17 µSv/yr, respectively. These levels are below the UNSCEAR (2006) standard value of 1 mSv/yr.
Ten samples with high activity concentrations ≥11 Bq L−1 Rn-222 (US EPA, 1993) were resampled in October 2022 and treated with the prepared activated charcoal. Selection criterion: initial Rn-222 ≥11 Bq L−1 to avoid bias and ensure representativeness. The results obtained before and after treatment are plotted as shown in Fig. (5).
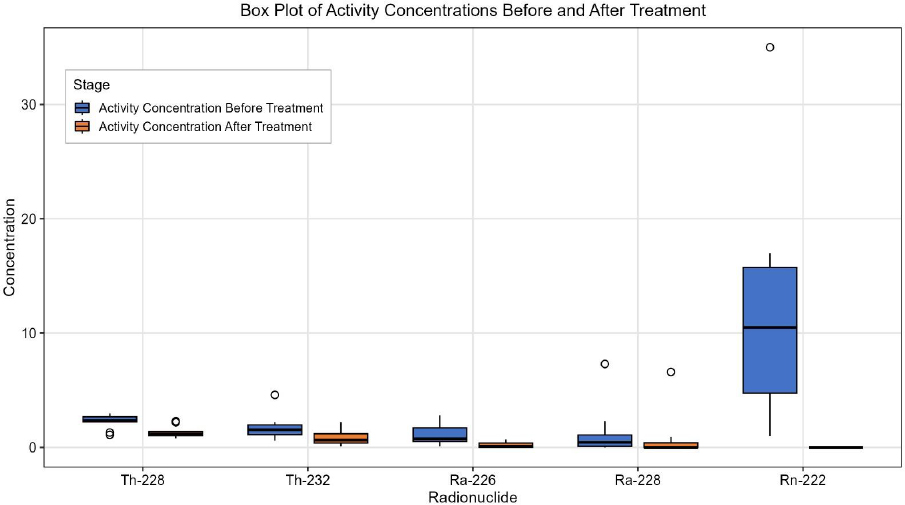
Box Plot of Activity Concentration before and after treatment with Activated Charcoal (Means ± SD (n=3); paired t-test p).
From Fig. (5), it can be observed that Rn-222 has the largest difference between the initial and final concentrations, followed by Ra-226, Th-232, and Ra-228, with the least being Th-228. This implies that the activated charcoal has a high affinity for Rn-222 and Ra-226. These results agree with those of a similar study conducted by Yehia et al. (2024), who removed Rn-222 from radon-induced water under controlled laboratory conditions.
CONCLUSION
Locally prepared activated charcoal from coconut husk proved to be a low-cost, effective adsorbent for groundwater remediation in Teiman, Greater Accra Region. Key findings are:
- Rn-222 was reduced by 71 - 98% (mean 89 ± 8%) in the ten samples with initial concentrations ≥11 Bq L-1, bringing all treated samples well below the USEPA maximum contaminant level of 11 Bq L-1.
- Ra-226 and Th-232 series radionuclides were removed by 78 - 97%.
- Hardness-causing cations were efficiently removed (Ca2+ 91.7 ± 1.2%, Mg2+ 61.8 ± 1.4%), whereas Na+ and K+ showed moderate removal (54 - 63%). Among anions, nitrate was most effectively adsorbed (84.6 ± 4.9%), sulphate 68.7 ± 6.2%, while chloride removal was limited (32.4 ± 5.8%).
- EC and TDS decreased by ~42%, salinity by ~59%, and pH shifted from slightly acidic (6.2 ± 0.4) to neutral (7.5 ± 0.3), remaining within WHO drinking-water guidelines. No significant leaching of Ca2+ or Cl− from the activator was detected.
- Annual effective doses from radon ingestion and inhalation after treatment are negligible (<0.03 µSv yr-1 and <10 µSv yr-1, respectively), far below the 0.1 mSv yr-1 reference level.
The method is therefore suitable for small-scale community or point-of-use treatment in areas underlain by uranium-rich Precambrian rocks. Limitations include relatively low chloride removal and limited verification to ~150 bed volumes; long-term breakthrough behaviour and regeneration/reuse studies are recommended for future work.
AUTHORS’ CONTRIBUTIONS
It is hereby acknowledged that all authors have accepted responsibility for the manuscript's content and consented to its submission. They have meticulously reviewed all results and unanimously approved the final version of the manuscript.
AVAILABILITY OF DATA AND MATERIALS
The authors confirm that the data supporting the findings of this research are available within the article.
ACKNOWLEDGEMENTS
Declared none.

