All published articles of this journal are available on ScienceDirect.

Evaluating Conventional and Machine Learning Models for Soil Moisture Effects on Radon Exhalation and Indoor Radon Levels
Authors Info & Affiliations
Abstract
Introduction
This study compares the performance of machine-learning linear regression and random forest models with the conventional correlation analysis in the prediction of the influence of soil moisture on radon exhalation and indoor radon levels.
Methods
Radon exhalation rates from the soil were experimentally determined using the sealed-can method. Soil moisture content was estimated using their wet and dry masses. Conventional correlation analysis was conducted to assess the relationships between moisture content and radon parameters. Linear regression and random forest machine learning models were applied to evaluate their predictive performance.
Results
Conventional correlation revealed a strong negative association between soil moisture and radon exhalation (R=-0.82), and a weaker association with indoor radon (R=-0.30). The linear regression analysis showed limited predictive capacity for moisture and radon exhalation rate, with a training correlation of 0.42, and a negative testing coefficient of -16.0. The random forest showed higher values of 0.65 and -5.52 for the training correlation and testing coefficient, respectively, indicating poor overfitting potential. Between moisture content and indoor radon, the linear regression yielded a training correlation of 0.42 with a -2.17 testing coefficient, while the random forest returned 0.65 and -1.22, respectively.
Discussion
The results confirm that soil moisture influences radon exhalation. However, both models exhibited weak predictive performanc and, poor generalization,highlighting the complexity of radon-moisture interactions.
Conclusion
This work re-emphasizes the need for improvement in predictive models, such as the use of non-linear algorithms, consideration of additional environmental factors, and enhanced validation strategies to improve accuracy in predictive correlation studies on radon.
1. INTRODUCTION
The decay series of U-238 is the main origin of radon, a naturally occurring radioactive noble gas found in all rocks and soil. Radon, after its release from the soil, gets distributed in an indoor environment through cracks and fractures in building foundations (Tommasino, 2005). Since there has been sufficient proof that radon and its progenies can cause lung cancer, the World Health Organization (WHO) International Agency for Research on Cancer (IARC) has classified radon as carcinogenic to humans (WHO, 2024). According to the US Environmental Protection Agency (USEPA), radon is the second most common cause of lung cancer and the most prevalent cause of lung cancer in nonsmokers (USEPA, 2024). Soil is the primary source of radon gas (Stoulos, 2024). The emanation of radon gas from the soil is influenced by many factors, such as soil grain sizes, soil moisture content, soil porosity, soil permeability, and the radium content. Among these, soil moisture content represents a vital factor affecting radon exhalation from the soil into outdoor environments (Sun, Guo, & Cheng, 2004). The association between soil moisture and radon exhalation has been investigated in prior studies. These studies often rely on traditional statistical methods such as regression analysis to quantify the strength of the relationships. These methods tend to provide a comprehensive overview of the relationship between these parameters, which could be essential in the development of predictive models for future radon studies (Yang, et al., 2019). However, new trends in machine learning provide more improved predictive models, such as linear regression and random forest models, which leverage more complex algorithms that can capture nonlinear relationships between the parameters to help make better predictions (Igwebuike, Ajayi, Okolie, Kanyerere, & Halihan, 2025). For example, as a supervised machine learning algorithm, linear regression typically learns from labeled datasets. It associates the data points with the best linear functions that may be utilized for prediction. Additionally, it uses independent input parameters to predict continuous output variables (Sarker, 2021). Random forest, on the other hand, is built on decision trees for prediction analysis and can handle larger data sets due to its capability to work with many variables, giving it a more competitive advantage than conventional regression models (Ao, Li, Zhu, Ali, & Yang, 2019). To broaden the knowledge of the association between soil moisture and radon gas exhalation from the soil, the objective of this research is to compare the performance of the random forest and linear regression machine learning models perform to the traditional statistical method based on the experimental data reported by Asare, employed to analyze the relationship between radon exhalation and soil moisture (Asare, Otoo, Adukpo, & Opoku-Ntim, 2024). The experimental data explored the correlation between soil moisture content and radon exhalation using the traditional statistical linear R2-coefficient. The soil moisture content was estimated from the masses of the dry and wet soil aggregates, and the surface radon exhalation was experimentally measured using the sealed can method (Asare, Otoo, Adukpo, & Opoku-Ntim, 2024). Studies conducted have demonstrated the non-linearity of the relationship between soil moisture and radon exhalation. For instance, at low moisture levels, water may enhance the transport of radon through increased capillary action, thereby improving radon emanation. However, at higher moisture levels, water blocks soil pores and reduces diffusion pathways, limiting radon movement to soil surfaces. This results in a bell-shaped or exponential response curve as reported by Griffiths and Manohar (Griffiths, Zahorowski, Element, & Werczynski, 2010) (Manohar, Meijer, & Herber, 2013). As such, modeling this relationship with linear methods may oversimplify its complexity, thereby underscoring the need for machine learning methods. This study thereby seeks to evaluate the performance of different machine learning methods as compared to conventional methods, to assess the correlation between soil moisture, radon exhalation, and indoor radon.
2. METHODOLOGY
2.1. Study Design
This study adopts an analytical and quantitative observational approach to seek to answer the question: How does soil moisture content influence radon exhalation and indoor radon levels, and how do conventional correlation methods compare with machine learning models in predicting this relationship? The methodology involves a quantitative approach, combining experimental measurements and predictive modeling. It involved measuring soil moisture, radon exhalation rates, and indoor radon concentrations from fourteen (14) sampling points. Soil moisture was determined by measuring the mass of soil aggregates, radon exhalation rates were estimated using the sealed can technique, and indoor radon concentrations were assessed with CR-39 detectors deployed at various sampling points. The alpha tracks recorded on each detector were used to estimate the radon activity concentration using the RadoSys Radometer 2000 System. The fourteen sampling locations, along with their corresponding geographical coordinates, are listed in Table 1. The data collected were analyzed using both conventional statistical correlation, linear regression, and random forest machine learning models. Data preprocessing, model training, testing, and evaluation were performed using Python and Scikit-learn libraries. Independent variables included soil moisture, and dependent variables were radon exhalation and indoor radon levels. The performance of the models was assessed using correlation coefficients and R2 scores for training and testing datasets.
| SAMPLE ID | LATITUDE | LONGITUDE |
|---|---|---|
| N2 | 5°40'41.09”N | 0°13'14.09”W |
| A2 | 5°40'43.06”N | 0°13'10.09”W |
| W1 | 5°40'42.07”N | 0°13'7.03”W |
| K1 | 5°40'39.01”N | 0°13'8.02”W |
| A1 | 5°40'39.03”N | 0°13'9.09”W |
| C1 | 5°40'40.06”N | 0°13'10.03”W |
| R1 | 5°40'40.01”N | 0°13'14.09”W |
| M1 | 5°40'41.06”N | 0°13'16.02”W |
| R2 | 5°40'38.05”N | 0°13'14.07”W |
| G1 | 5°40'34.07”N | 0°13'7.02”W |
| B1 | 5°40'33.03”N | 0°13'3.01”W |
| S2 | 5°39'55.08”N | 0°13'44.01”W |
| S1 | 5°40'01.03”N | 0°13'44.06”W |
| N1 | 5°40'40.05”N | 0°13'10.02”W |
2.2. Inclusion and Exclusion Criteria
2.2.1. Inclusion Criteria
- Sampling locations must be within the designated study area and accessible for both soil and indoor measurements. Sites where soil samples could be collected undisturbed for moisture content analysis and sealed-can radon exhalation experiments.
- Rooms that were regularly occupied and suitable for CR-39 detector deployment over the ninety-day sampling period.
- Data sets with complete records of soil moisture, radon exhalation, and indoor radon concentrations.
2.2.2. Exclusion Criteria
- Sampling locations with missing and incomplete measurement records during the sampling period
- Sites that underwent environmental changes, like flooding, could bias results.
- Rooms with unusual radon sources, such as proximity to industrial facilities, that would confound the findings.
- Soil samples were compromised during collection, handling, or laboratory procedures.
2.3. Machine Learning Method
To compare different machine learning models, the data, as shown in Table 2, obtained from the soil moisture content, indoor radon levels, and the radon exhalation measured experimentally from the soil samples, were imported into an Excel datasheet. The dataset was then converted into a comma-separated value format to make it more uniform and optimized for processing. It was then exported to the GitHub platform for easy access. The analysis and model comparisons for this study were carried out using Python, as illustrated in Fig. (1) (Kim, 2024).
| Sampling ID | Moisture Content | Surface Exhalation Rate, Bqm-2h-1 |
Mass Exhalation Rate, Bqkg-1h-1 |
Average Indoor Radon Concentration, Bq/m3 |
|---|---|---|---|---|
| N1 | 0.11 | 0.89 | 0.03 | 117 ± 12 |
| M1 | 0.09 | 0.74 | 0.03 | 98 ± 12 |
| B1 | 0.09 | 0.86 | 0.03 | 115 ± 12 |
| S1 | 0.09 | 0.7 | 0.02 | 103 ± 12 |
| G1 | 0.05 | 0.4 | 0.01 | 99 ± 11 |
| A2 | 0.15 | 0.32 | 0.01 | 89 ± 12 |
| R1 | 0.07 | 0.88 | 0.03 | 104 ± 10 |
| S2 | 0.04 | 0.43 | 0.01 | 93 ± 10 |
| W1 | 0.08 | 0.96 | 0.03 | 101 ± 11 |
| K1 | 0.10 | 0.93 | 0.03 | 108 ± 10 |
| C1 | 0.11 | 0.81 | 0.03 | 112 ± 12 |
| N2 | 0.10 | 0.59 | 0.02 | 111 ± 11 |
| R2 | 0.09 | 0.57 | 0.02 | 108 ± 11 |
| A1 | 0.09 | 0.08 | 0.02 | 93 ± 12 |
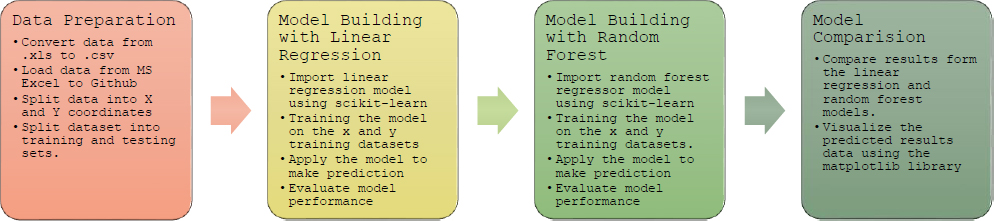
The various processes in the machine learning process from data preparation to the comparison of linear regression and random forest models for this study.
2.4. Preparation of Data for Model Building
The data preparation process was conducted using the pandas Python library. The dataset was imported directly from using the pd.read_csv() function, as demonstrated by the code snippet import pandas as pd; df = pd.read_csv(‘https://raw.githubser/kdk.csv’); df.
Subsequently, the data were partitioned into dependent (y) and independent (x) variables. The ‘logS’ column was designated as the dependent variable (y), extracted using y= df(‘logS’); y. The remaining columns were assigned as independent variables (x) by dropping the ‘logS’ column using x=df.drop(‘logS’, axis=1); x.
2.5. Splitting the Data into Training and Testing Datasets
The train_test_split function from the scikit-learn library was then used to split the prepared data into training and testing datasets (from sklearn.model_selection import train_test_split). This function divided the independent (x) and dependent(y) variables into training and testing sets. A 20% test size was designated (test_size=0.2), which means 80% of the data was allocated for training and 20% for testing. A random state of 100 (random_state=100) was established with the objective of ensuring the data split's reproducibility. The resulting datasets were assigned to x_train, x_test, y_train, and y_test.
2.6. Building a Model with Linear Regression
To determine the relationship between the independent variables (x_train) and the dependent variable (y_train), a linear regression model was built. This was achieved using the LinearRegression class from the scikit-learn library, imported from the code from sklearn.linear_model import LinearRegression. A model instance was constructed and allocated to the variable lr (lr= LinearRegression()). The fit method was then used to train the model, which laid out the association between the features (x_train) and the target variable (y_train) (lr.fit(x_train, y_train)). The model is designed to make predictions on previously unseen data through this training approach.
2.7. Applying the Model to Make a Prediction
Following training, predictions were carried out using the linear regression model on both the training and testing datasets. Predictions on the training data (x_train) were generated using the predict method and stored in y_lr_train_pred (y_lr_train_pred= lr.predict(x_train)). Similarly, predictions on the unseen testing data (x_test) were generated and stored in y_lr_test_pred (y_lr_test_pred= lr.predict(x_test)). These predicted values were then used to evaluate the model’s performance.
2.8. Evaluating the Performance of the Models
The R-squared score and mean squared error were used to assess the model's performance, both of which were provided by scikit-learn.metrics module (from sklearn.metrics import mean_squared_error, r2_score). The percentage of variance in the dependent variable that can be predicted from the independent variables is represented by the mean square error, which is computed using mean_squared_error and quantifies the R2 score. The metrics were computed for both the training and testing sets. Specifically, rf_train_mse and rf_train_r2 represent the mean square error and R2 score for the training data, rf_test_r2 represents the mean square error and R2 score for the testing data, calculated using y_test and y_rf_test_pred. Similarly, rf_test_mse and rf_test_r2 represent the mean square error and R2 score for the testing data, calculated using y_test and y_rf_test_pred. These metrics offer a thorough evaluation of the predicted accuracy of the model and goodness of fit.
3. RESULTS AND DISCUSSION
3.1. Moisture Content and Surface Exhalation
3.1.1. Linear Regression Model
Applying the linear regression model, the metric obtained from the evaluation of the performance of the model is illustrated in Table 3. The metrics showed important facets of the linear regression model's performance. The very low training mean square error indicates a strong fit to the training data, with minimal average squared difference between actual and predicted values (Pandey, Singh, Khatri, & Verma, 2022). However, the R2 of 0.42 for the training data implies that the model clarifies only approximately 42% of the variance in the Surface exhalation within the training set, indicating a moderate fit.
| Method | Correlation Co-efficient |
|---|---|
| Experimental | 0.82 |
| Linear Regression Model | 0.42 |
| Random Forest Model | 0.75 |
3.1.2. Linear Regression Model Comparison with Experimental Results
A single-factor ANOVA was used to test for the significance of the findings, and a p-value of less than 0.05 indicated that the differences between the experimentally determined mean moisture content and radon exhalation rates were significant (Liza, et al., 2025). The correlation analysis performed on the experimental data yielded a Pearson coefficient value of -0.82, which indicated a significant inverse relationship between the accompanying surface exhalation and the experimental moisture data as shown in Fig. (2). To validate this experimental correlation, a machine learning linear model was performed on the surface exhalation and moisture content data, which yielded a correlation co-efficient of 0.42 and -16.0 for training and testing linear regression coefficient respectively. Although the model yielded a positive correlation, the discrepancy between the experimental correlation and the machine learning-derived correlation suggests observed potential inconsistencies in its model performance. This may be due to data sparsity, overfitting, or the inadequate feature selection process. Further analysis of non-linear relationships using more complex models, such as Random Forest regression,ould be explored to enhance predictive accuracy (Ying, 2019).
3.1.3. Random Forest Model
To address the linear model incompatibility with the data, an alternative ensemble model, like the Random Forest, was explored. The results for the random forest model present a similar pattern, but with some differences. The zero training mean square error indicates a perfect match to the training data. The training R-squared of 0.74 further supports that the model explains approximately 74.9% of the variance in the training data. However, this perfect training performance is juxtaposed with a concerning test R2 of -5.52. As with the linear regression model, a negative test R2 indicates that the Random Forest model performs substantially worse than a simple baseline model that predicts the mean of the surface exhalation. This strongly suggests overfitting, where the model is unable to generalize to new input since it has committed the training data to memory. A very small test mean-square error coupled with a negative R2 further indicates poor predictive performance (Alexander, Tropsha, & Winkler, 2015). The combination of perfect training performance and poor test performance reinforces the diagnosis of severe overfitting, further suggesting that the model in its current state is capturing noise specific to the training set rather than the underlying relationship between the surface exhalation and moisture content.
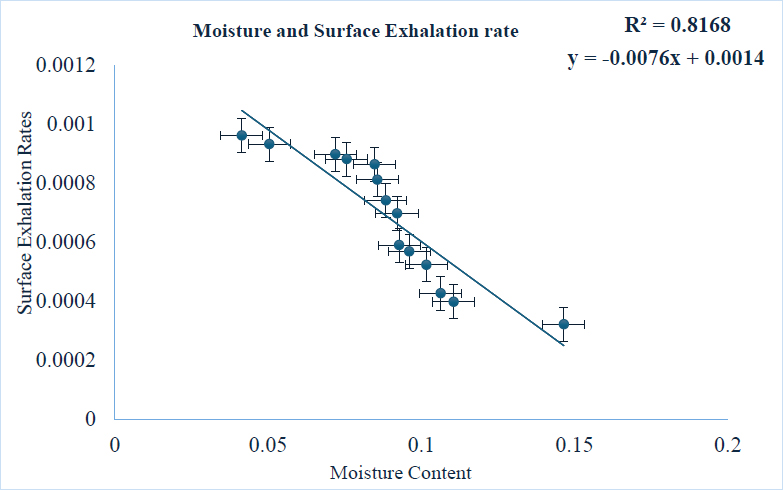
A graph displaying the Pearson coefficient for radon exhalation rates and moisture content (Asare, Otoo, Adukpo, & Opoku-Ntim, 2024).
3.1.4. Random Forest Model Comparison with Experimental Results
To further assess the association between radon exhalation and moisture content, the random forest regression model was employed. The model yielded a training and testing correlation coefficient of 0.75 and -5.52, respectively, as shown in Table 2. Given the comparatively high training correlation coefficient, it appears that the model successfully identified patterns in the data relative to the linear regression model. This relatively high correlation coefficient of 0.75 can be compared to the experimental Pearson correlation coefficient of 0.82, indicating better model performance. However, the large negative testing coefficient indicates severe overfitting, which could be a result of the model failing to generalize to unseen or insufficient data.
3.2. Moisture Content and Indoor Radon
3.2.1. Linear Regression
The model's predictions on the training data exhibit a moderate degree of error, as indicated by a training mean square error of 34.64. This indicates that the model's predictions deviate from the actual values by an approximate mean of the square root of 34.64 units. The training R-squared of 0.42 implies that the model illustrates roughly 42% of the variance in indoor radon levels based on moisture content. This indicates a moderate fit, implying that moisture content alone does not fully explain the variations in indoor radon.
3.2.2. Linear Regression Model Comparison with Experimental Results
To determine the significance of the data, a single-factor ANOVA was used to analyze the differences between the mean indoor radon and moisture content obtained from this work. The results indicated a statistically significant result, indicating a p-value below 0.05. From the experimental work, a weak negative correlation coefficient of -0.3 was estimated as shown in Fig. (3) between the moisture content and its associated indoor radon levels, suggesting a weaker inverse relationship exists between them, as moisture content alone may not be a strong predictor of indoor radon concentrations, implying that other environmental factors could also influence indoor radon behavior. To evaluate the performance of the machine-learning linear and random forest models in predicting the correlation between the indoor radon and moisture content data, the models were effectively applied. A linear regression model applied to the dataset yielded a training correlation co-efficient of 0.42 and testing correlation coefficient of -2.18, indicating a better performance of the model, however, the negative testing coefficient implied that the model failed to generalize to unseen data which may be due to overfitting and the model may not capture the complexity of the data due to non-linearity in the datasets (Aliferis & Simon, 2024).
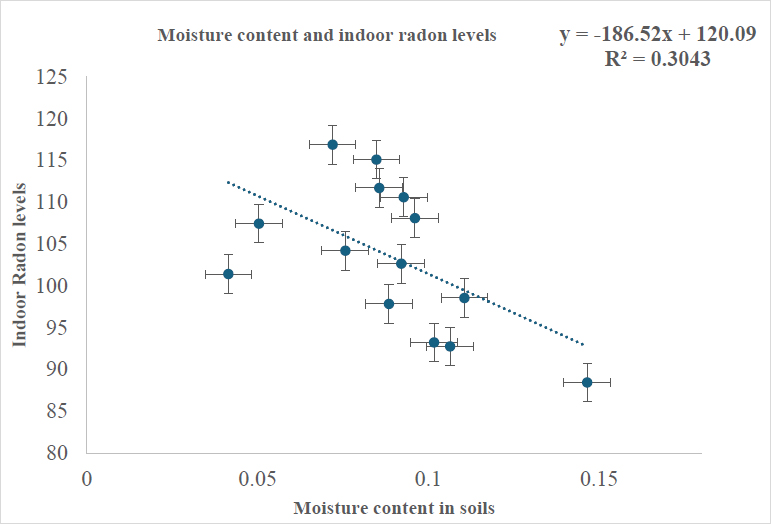
A graph displaying the Pearson coefficient for indoor radon levels and moisture content (Asare, Otoo, Adukpo, & Opoku-Ntim, 2024)
3.2.3. Random Forest Model
The random forest offers a similar narrative to the linear regression model. The training mean square error of 20.87 indicates a moderate level of error on the training data, suggesting the actual values in the training set and the model's predictions are quite comparable. According to the training R-squared of 0.65, the model accounts for roughly 65% of the variation in indoor radon levels based on moisture content within the training data. This represents a better fit to the training data compared to the linear regression model.
3.2.4. Random Forest Model Comparison with Experimental Results
To assess the behavior and performance of alternative models, the random forest model was employed. From Table 4, the model produced a training correlation coefficient of 0.65 and a testing correlation coefficient of -1.22, suggesting moderate training accuracy relative to the experimental Pearson’s coefficient. However, the negative testing coefficient indicates a weak generalization to new data, which may be caused by overfitting and a limited dataset for the model to recognize patterns.
| Method | Correlation Co-efficient |
|---|---|
| Experimental | 0.30 |
| Linear Regression Model | 0.42 |
| Random Forest Model | 0.65 |
3.3. Limitations of the Applied Machine-learning Models
Both models show observable limitations that could influence their predictive performance. For instance, the applied linear regression model overestimates a direct correlation between the moisture content and radon exhalation, which results in oversimplifying the complex non-linear processes involved in radon emanation influenced by many environmental factors and soil parameters. This oversimplification, along with the limited set where moisture content is the sole predictor, can result in poor model performance, as evidenced by the low training correlation of 0.42 and the high negative testing coefficient of -16.0. Similarly, the random forest model, while performing better on the training data, still suffers from overfitting as indicated by its testing coefficient of -1.22. This discrepancy suggests that the model may be capturing noise rather than the underlying signal, which may be due to the small nature of the dataset. Moreover, the cross-validation in the model evaluation further undermines the reliability of the performance metrics, raising concerns about the robustness of these approaches to new data (Varoquaux, 2018).
CONCLUSION
The experimental Pearson correlation analysis indicated a strong negative correlation between soil moisture and radon exhalation, suggesting an inverse relationship. However, both machine learning models exhibited poor generalization performance, with negative testing correlation coefficients indicating overfitting. For indoor radon, a weak negative experimental correlation was observed, and machine learning models similarly failed to produce reliable predictions. These findings highlight the limitations of current applied models and suggest that incorporating additional predictive variables, applying non-linear modeling approaches, and adopting more rigorous validation strategies may be necessary to improve predictive accuracy in studies examining environmental factors that affect radon levels.
AUTHORS’ CONTRIBUTIONS
The authors confirm their contribution to the paper as follows: O.K.A., A.M.A.D., and I.T.: Data analysis and interpretation were carried out; I.O.N.: Methodology was developed; E.O.A., F.O., and R.K.: The draft manuscript was prepared. All authors reviewed the results and approved the final version of the manuscript.
LIST OF ABBREVIATIONS
| IARC | = International Agency for Research on Cancer |
| US EPA | = United States Environmental Protection Agency |
| WHO | = World Health Organization |
AVAILABILITY OF DATA AND MATERIALS
The data supporting the findings of this article are available from the corresponding author [E.O.A] upon reasonable request.
ACKNOWLEDGEMENTS
Declared none.

