All published articles of this journal are available on ScienceDirect.

Carbon Emission Trends and Their Economic Implications: A Heuristic Approach to Information-Poor Environments
Abstract
Introduction
Carbon emission models are essential tools for analysing and predicting emission trends. However, the development of such models is often limited by a lack of sufficient data, making traditional statistical approaches difficult to apply. This study proposes a novel, qualitative, trend-based modelling framework that utilizes equation-less heuristics as an alternative to conventional, data-intensive carbon emission models.
Methods
The model employs a trend reasoning method based on expert knowledge and simplified indicators (increasing, constant, decreasing), applied to qualitative variables such as carbon strategy and profitability. Verbal knowledge statements are formalized without numerical values, allowing modelling in information-poor environments.
Results
The resulting model generated 29 internally consistent future scenarios with defined trend-based transitions between them. The structure allows integration of interdisciplinary insights from economics, environmental science, engineering, and policy domains.
Discussion
The proposed model enables structured analysis of emission scenarios without the need for precise data. It is flexible but relies on expert judgment and does not quantify scenario probabilities. Still, it offers valuable support for decision-making under uncertainty.
Conclusion
Trend-based models using qualitative reasoning provide a low-data, high-flexibility alternative for exploring carbon emission dynamics, supporting decision-making processes even without formal training in modeling theory.
1. INTRODUCTION
Over the last decade, firms have witnessed increased public scrutiny of their environmental performance in the pursuit of proactive environmental initiatives and green investments (Moussa et al., 2020). Despite growing awareness and policy efforts, the market adoption of eco-innovations and sustainable practices continues to lag behind expectations (Byrka et al., 2016). Some investors claim that investing in higher-rated ESG stocks yields superior returns (Mercereau, Melin and Lugo, 2022), but empirical findings remain inconclusive and fragmented. Research has yet to explain the underlying mechanisms linking ESG behavior and financial outcomes (Lee and Suh, 2022). Moreover, macroeconomic and institutional uncertainty factors such as economic policy uncertainty (EPU), political instability (POI), cultural uncertainty avoidance (CUA), and carbon emission reduction targets (CER) remain difficult to quantify and often resist conventional modeling approaches (Alandejani and Al-Shaer, 2023).
As decision-makers face increasing pressure to act in complex, data-limited environments, there is a growing need for carbon emission models (CEMs) that can operate under uncertainty. However, traditional formal tools, typically based on statistical or optimization techniques, often require extensive, high-quality data, and may struggle to represent qualitative relationships or expert intuition. Different types of users (e.g., policymakers, engineers, analysts) demand diverse forms of CEMs suited to their knowledge bases and goals (Soldo, 2012; Brook and Blomqvist, 2016; Skapa, Novotna and Meluzin, 2020). Therefore, a flexible modeling approach that allows the use of non-numerical, verbal knowledge is urgently needed.
This paper introduces a trend-based qualitative modeling approach that is specifically designed for information-poor environments. Instead of relying on equations or precise data, the model leverages expert-defined relationships (support/reduce) and interprets dynamic developments using qualitative trend triplets. The key contribution of this work lies in the development of a scenario-generating model that structures variable behaviors over time using a transition graph of possible qualitative states. This approach aims to provide decision support in domains where exact forecasts are infeasible but directional reasoning is still valuable.
Modeling in social and economic systems has a long tradition, often based on classical equilibrium-based frameworks inspired by physics. However, as systems grow more complex and interdependent, such models increasingly fail to capture dynamic, qualitative behaviors (Kim and Edgar, 2014).
In the context of CEM various formal tools have been employed ranging from mathematical programming (Kim and Edgar, 2014; D’Ambrosio et al., 2015) to fuzzy logic and soft sets (Xiao, Gong and Zou, 2009; Atalay, Eraslan and Çinar, 2015). While these approaches are powerful, they typically require quantifiable, structured input data and clearly defined constraints. However, such structured formulations are often not available in practice. Many CEM-relevant variables (e.g., ESG indicators, policy responses) are difficult to measure or forecast using classical statistical tools. This creates a need for models that can incorporate verbal, imprecise, or expert-based knowledge (Gillingham et al., 2018).
This paper builds on the idea of common-sense algorithms, which operate with only four qualitative values: positive, zero, negative, and unknown (or anything). Such minimal information can still enable structured modeling through logical consistency and trend relations (Škapa et al., 2023). Among all verbal descriptors, trends described as increasing, constant, or decreasing are the least information-intensive yet most informative, especially when combined into qualitative triplets (Dohnal, 1985). The trend represents a first time derivative. If this cannot be defined, no reliable simulation or prediction is possible.
2. METHODS
The urgent need to reform sectors such as energy, housing, transportation, agriculture, and health due to resource constraints highlights the growing relevance of carbon emission models (CEMs), by (Zeppini, Frenken and Kupers, 2014). The tasks addressed by CEMs are highly heterogeneous, reflecting the complexity of real-world systems. Within these models, deep knowledge refers to well-established laws that represent undisputed components of a given theory. For example, the law of gravity serves as a typical case of such knowledge. However, these elements are rarely integrated into non-engineering CEM submodels. In contrast, shallow knowledge is based on heuristics or statistical outcomes derived from passive observations and often includes many exceptions by (Orrell and McSharry, 2009). Most practical CEMs rely almost entirely on this second type of knowledge. In order to model shallow knowledge effectively, a formal but flexible modeling approach is needed.
This paper proposes a modeling strategy based on pairwise qualitative relationships between variables. Specifically, we distinguish between two types of monotonic influence: SUPPORT, denoting direct proportionality (an increase in X leads to an increase in Y), and REDUCE, indicating inverse proportionality (an increase in X leads to a decrease in Y).
These relationships form the foundation of qualitative trend-based models that operate without numerical inputs and focus instead on logical consistency and directional reasoning.
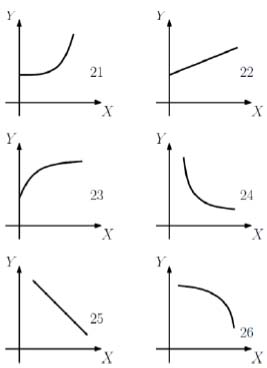
The accuracy of models based on shallow knowledge improves when second-order trend derivatives are known. Examples of such trend relationships are provided in Fig. (1).
All pairwise relations shown in Fig. (1) can be expressed as P(X, Y). These describe trends without numerical values. For example, relation 21 in the figure means that the relation is increasing, the first derivative of Y with respect to X is positive, the rate of increase is accelerating, and if X equals zero, then Y is already positive. U-shaped relationships, such as those between carbon emissions and inclusive financial systems (Hussain et al., 2023), cannot be represented using the formats in Fig. (1). However, this limitation can be overcome by dividing the U-shape into two submodules.
2.1. Trend Models
The concept of a trend may vary depending on context, as discussed by (Xie et al., 2017). This paper focuses on four basic trend values, as outlined by (Vicha and Dohnal, 2008b) . These values are positive, zero, negative, and unknown. Corresponding derivatives are described as increasing, constant, decreasing, or undetermined.
The term scenario is used differently across disciplines, as noted by (Gong et al., 2017). In this paper, a scenario is defined as a sequence of qualitative triplets. Each triplet consists of a variable, its first derivative, and its second derivative. This is written as:
S(n, m) is the sequence (X1, DX1, DDX1), (X2, DX2, DDX2), …, (Xn, DXn, DDXn) for j ranging from 1 to n.
Here, DX represents the first qualitative derivative over time, and DDX the second. Often, only the first derivative is known, so the second is marked as unknown. This is represented by triplets in the form (X, DX, *). Solving such a qualitative model becomes a combinatorial problem. This is beyond the scope of this paper but is described in more detail by (Vicha and Dohnal, 2008a).
2.2. Cems Unsteady State Behaviors – Transitional Graph
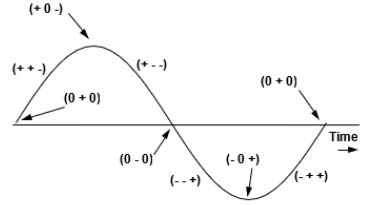
A simple analysis from classical mechanics shows that a moving spring must come to rest before changing direction. This means that certain transitions between triplets are not physically possible.
Triplets shown in Fig. (2) represent trend-based oscillations. Each row lists possible transitions from one triplet to another, including alternative paths:
| From | - | To | a | b | c | d | e | f |
|---|---|---|---|---|---|---|---|---|
| Or | Or | Or | Or | Or | Or | |||
| +++ | → | ++0 | - | - | - | - | - | - |
| ++0 | → | +++ | ++- | - | - | - | - | - |
| - | - | - | - | - | - | - | - | - |
| ++- | → | ++0 | +0- | +00 | - | - | - | - |
| +0+ | → | +++ | - | - | - | - | - | - |
| +00 | → | +++ | +-- | - | - | - | - | - |
| +0- | → | +-- | - | - | - | - | - | - |
| +-+ | → | +-0 | +0+ | +00 | 0-+ | 00+ | 000 | 0-0 |
| +-0 | → | +-+ | +-- | 0-0 | - | - | - | - |
| +-- | → | +-0 | 0-- | 0-0 | - | - | - | - |
Table 1 lists permissible one-dimensional transitions between triplet states, ensuring physical and logical plausibility (e.g., avoiding impossible direct reversals like + + + to + − −).
A transitional graph is a directed graph. Its nodes are the possible scenarios S, and its directed edges are the transitions. This structure is denoted as H (S, T).
2.3. Trend Decision Making
Let X be a set of variables X1 to Xn. This set can be divided into three subsets. The first subset V, contains decision variables. The second subset G, contains goal variables. The third subset O includes variables that are not under control.
The interpretation of O depends on the decision maker. For example, for a company manager and a government official, the meaning of O may differ significantly. Consequently, future system behavior depends heavily on how this set is interpreted.
Uncertainty in O can be addressed using random number generators. However, this approach is not applicable when a government considers taxation as an uncontrollable variable. In such cases, decisions are informed by partially known relationships between variables in all three sets V, G, and O.
These relationships can be captured in the function O equals F of V and G. This defines a trend-based model that can be used to eliminate the variables in O. The overall model takes the form:
M is a function of X, which is also a function of V, G, and O, where O equals a function of V and G
2.4. Modeling Process Overview
The methodological approach adopted in this study follows a structured sequence that ensures both logical coherence and practical applicability of the proposed trend-based model. The process begins with expert input, where specialists in environmental economics and ESG systems contribute qualitative insights, identify relevant variables, and define plausible relationships among them. Based on this input, a set of variables is selected according to their conceptual clarity, interpretability, and relevance to carbon emission modeling. These variables are then categorized into decision variables (V), goal variables (G), and off-control variables (O), allowing the model to reflect real-world strategic structures.
Subsequently, qualitative relationships between variables are encoded using the operators SUPPORT and REDUCE, representing direct and inverse proportionalities. Each variable is described using a trend triplet composed of its current value, first qualitative derivative (DX), and second derivative (DDX), capturing not only the direction of change but also its dynamic behavior over time. These verbal relationships form the foundation of a model that operates entirely without numeric inputs. To ensure internal consistency, a logical checking procedure is applied to identify contradictions or circular dependencies, and adjustments are made through expert feedback to preserve model integrity.
Once consistency is achieved, the model generates a comprehensive set of logically valid scenarios, where each scenario represents a unique qualitative state of the system. From these scenarios, a transition graph is constructed: a directed graph in which each node denotes a scenario and each edge a permitted transition based on trend rules. This graph enables exploration of plausible developmental paths, identification of equilibrium states, and detection of critical leverage points within the system. The final model thus serves as a decision-support tool that facilitates strategic reasoning under uncertainty, especially in situations where numerical data are scarce or unavailable.
2.5. Experimental
This section presents the implementation and internal validation of the proposed trend-based qualitative modeling framework. The aim is to demonstrate the model’s practical application in a structured, low-data environment and to verify its internal consistency using a synthetic ESG-financial system. The modeling approach is grounded in expert input and qualitative logic rather than statistical generalization, and it focuses on directional reasoning under uncertainty. Although no empirical sample was used, the model was internally validated using a synthetic ESG-financial system, ensuring logical consistency across all generated scenarios and transitions. Sample adequacy in this context corresponds to full combinatorial coverage of all logically valid variable configurations.
The initial scope of the model was defined in consultation with domain experts specializing in environmental economics, sustainability reporting, and corporate finance. A preliminary list of eleven candidate variables was derived from (Moussa et al., 2020). These variables represent environmental performance, governance structure, and financial indicators typically linked to carbon strategies. Based on relevance, qualitative interpretability, and conceptual clarity, the final set of nine variables was selected. These include carbon performance (GHG), carbon strategy (CAS), board environmental orientation (BOE), profitability (PRO), loss (LOS), capital expenditure (CAE), leverage (LEV), block shareholding (BLS), and firm size (FSI).
Each variable was expressed through a trend triplet denoting its current qualitative state: the direction of change (first derivative), the change of that direction (second derivative), and the variable itself. The model does not depend on absolute values or rates but instead captures structural causality through verbal relationships. For the purposes of the case study, CAS was defined as the decision variable (V), GHG as the target variable (G), and LOS as the off-control variable (O). The remaining variables were structurally relevant and served to connect the decision and goal layers of the model.
Pairwise relationships were then encoded between variables using the qualitative operators SUPPORT and REDUCE. For instance, an increase in carbon strategy was assumed to support profitability, while an increase in leverage was assumed to reduce profitability. These relationships were derived from expert elicitation, supported by existing literature, and translated into a structured matrix of qualitative interactions. Each interaction was verified to be logically consistent with the assigned direction of influence and trend representation.
In the initial configuration, several logical inconsistencies emerged. These contradictions occurred when chains of trend relationships resulted in conflicting expectations about the behavior of certain variables. A rule-based consistency-checking algorithm, adapted from (Vicha and Dohnal, 2008b), was applied to identify and resolve these contradictions. Expert intervention was used to modify or eliminate ambiguous relationships, resulting in a logically complete and conflict-free model structure.
Once consistency was achieved, the model generated a set of twenty-nine valid qualitative scenarios. Each scenario represented a unique configuration of all nine variables, expressed as a complete set of trend triplets. These scenarios collectively describe the plausible qualitative states of the system under the defined relational framework. From this scenario set, a transition graph was constructed. Each node in the graph corresponds to a scenario, and each directed edge represents a permitted transition between scenarios based on one-dimensional trend rules. These transitions capture the possible evolution of the system over time, constrained by qualitative derivative logic.
To illustrate the application and internal coherence of the model, a synthetic validation example was constructed. In this test case, CAS was assumed to be increasing with uncertain acceleration, LEV was increasing at a constant rate, and PRO was decreasing. Based on the defined relationships, namely, that increasing CAS supports PRO, and increasing LEV reduces it, the model predicted that a reversal or stabilization of LEV, combined with sustained CAS improvement, should lead to a scenario where PRO begins to rise. This outcome was verified across multiple paths in the transition graph, confirming the logical coherence of the model’s internal mechanisms.
The resulting transition graph also revealed specific patterns of variable co-movement. Notably, CAS, BOE, and PRO exhibited strong alignment across most scenarios. This convergence suggests that improvements in environmental governance and strategy are consistently associated with improved financial outcomes in the modeled system. Furthermore, the model identified both equilibrium configurations and multiple progression paths from high-emission, high-loss scenarios to states characterized by reduced emissions and increased profitability.
Although the model does not rely on a statistical sampling framework, the scenario set represents an exhaustive enumeration of all logically consistent configurations under the defined variable set. This qualitative completeness ensures that the model provides sufficient internal coverage for decision-support purposes. Its structure allows stakeholders to simulate qualitative system behavior under uncertainty, even in the absence of precise empirical data or numerical forecasts.
A trend variable is characterized by its triplet. However, a careful analysis is required to identify good and bad triplets. As an example, GHG has the triplet (+++) as the worst variant, while PRO considers it the most ideal. The path below illustrates a complete trajectory through time:
A transition graph was constructed from the complete set of scenarios and allowed transitions (Table 2). Each node in the graph represents a scenario, and each directed edge denotes a permissible transition between scenarios based on the defined pairwise relationships. Scenario changes are achieved through modifications in one or more variable triplets, with some transitions requiring the adjustment of a single variable.
| - | GHG | CAS | BOE | PRO | LOS | CAE | LEV |
|---|---|---|---|---|---|---|---|
| 7 | +++ | +-- | +-- | +-- | +++ | +-- | +++ |
| 6 | +++ | +-- | +-- | +-- | +++ | +-- | +++ |
| 4 | +++ | 0 | 0 | 0 | +++ | 0 | 0 |
| 2 | +++ | +-+ | +-+ | +-+ | 0 | +-+ | ++- |
| 9 | 0 | +-+ | +-+ | +-+ | 0 | +-+ | ++- |
| 12 | ++- | +-+ | +-+ | +-+ | 0 | +-+ | ++- |
| 13 | ++- | +-+ | +-+ | +-+ | 0 | +-+ | ++- |
| 15 | 0 | 0 | 0 | 0 | 0 | 0 | 0 |
| 29 | +-- | +++ | +++ | +++ | +-- | +++ | +-- |
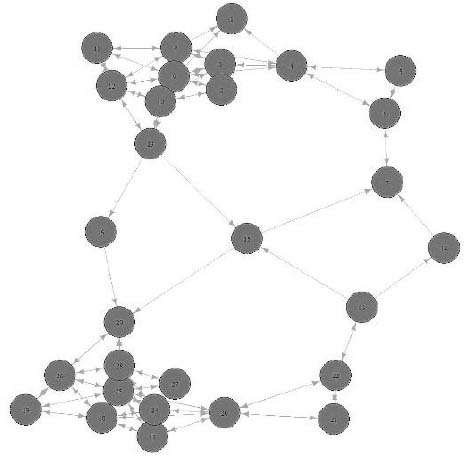
Complete set of the collection of scenarios and the matrix of possible transitions is used to develop the transitional graph (Fig. 3)
Each node represents one valid scenario; edges denote permissible qualitative transitions based on one-variable changes. The constructed model illustrates the structural relations, and dynamic pathways present within the defined ESG-financial system under a trend-based modeling framework. The graph structure enables the identification of multiple transition paths among the scenarios.
3. RESULTS
The implementation of the trend-based modeling framework resulted in the generation of twenty-nine logically consistent scenarios. Each scenario represents a qualitatively distinct system state, composed of the full set of trend triplets corresponding to the nine selected variables. These scenarios form a comprehensive and internally validated space of potential future configurations of the ESG-financial system under study.
The graph identified multiple progression paths between unfavorable and favorable configurations. For example, a scenario characterized by high GHG emissions, rising losses, and increasing leverage can evolve through a series of small transitions into a state where emissions decline and profitability, environmental governance, and strategic engagement all improve. These trajectories validate the model’s capacity to simulate meaningful developments within the system, even in the absence of quantitative projections. Equilibrium scenarios also emerged within the graph structure. These are states in which all variables display constant trends or are at points of local stabilization (e.g., triplets of the form (X,0,0)). Such configurations are especially relevant for decision-makers, as they may represent short-term system stability or strategic plateaus. From these points, the system may diverge toward improvement or degradation depending on changes in decision or off-control variables.
Additionally, certain nodes in the graph function as critical branching points. In these scenarios, small variations in a decision variable, particularly CAS, led to divergent system trajectories. This sensitivity highlights the potential leverage that targeted interventions may exert over system dynamics. For instance, maintaining an increasing trend in carbon strategy was frequently associated with transitions toward lower emissions and stronger financial performance, while reversing or halting this trend often led to stagnation or regression.
Overall, the model demonstrated a high degree of structural coherence and interpretability. Despite operating without numerical values or statistical data, the scenario set, and transition graph enabled a detailed exploration of qualitative dynamics. This illustrates the model’s utility as a decision-support tool, especially in contexts where quantitative forecasting is not feasible. Through expert-informed logic and directional reasoning, the framework supports scenario planning, policy design, and corporate strategy development in carbon-intensive sectors.
4. DISCUSSION
In contrast to existing qualitative CEM frameworks (e.g., Dohnal, 1985; Vicha and Dohnal, 2008a)The present model introduces a domain-specific application to ESG-financial dynamics, adds a structured variable classification into decision/goal/off-control sets, and integrates consistency-checking and expert-driven refinement to generate logically valid scenario spaces. The use of qualitative transition graphs for ESG systems constitutes a novel structural addition, particularly in how it captures directional system evolution without quantitative calibration. The model successfully translates verbal, expert-based relationships into a structured, logically consistent framework that facilitates scenario analysis under conditions of data scarcity and systemic uncertainty.
A key contribution of this approach lies in its capacity to incorporate shallow knowledge in the form of heuristic, experience-based, or semi-formal rules into a model that remains both analytically tractable and practically interpretable. While conventional models often require precise measurements and numeric optimization, this framework allows users to reason with minimal information, using only the direction and consistency of variable behavior. This feature makes it particularly well-suited for policy domains and corporate environments where full datasets are often unavailable or unreliable.
Importantly, the model preserves logical transparency throughout the modeling process. The stepwise construction procedure, combined with pairwise relational encoding, allows for traceable transitions between scenarios and supports a narrative form of analysis. This narrative quality, rooted in qualitative triplets and transition graphs, enables decision-makers to explore possible futures without relying on statistical prediction.
Nevertheless, several limitations must be acknowledged. First, the model is inherently subjective, as it depends on expert judgment for variable selection, relationship definition, and resolution of inconsistencies. This subjectivity, while not inherently problematic in qualitative research, may limit reproducibility across different expert groups. Second, the framework does not quantify uncertainty or probability; as such, it cannot determine which transitions are more likely, only which are possible. Third, while the algorithmic consistency checker ensures logical coherence within the defined system, it does not protect against structural incompleteness, i.e., missing variables or causal pathways that were never modeled in the first place.
The use of common-sense algorithms operating on the minimal set of qualitative values (positive, zero, negative, unknown) is both a strength and a constraint. These allow for robust, intuitive modeling where data are sparse, but they abstract away numerical nuances that might be crucial in some contexts. However, in complex decision spaces where interpretability and flexibility are prioritized, such abstraction may be preferable to the opacity of over-parameterized quantitative models.
From a methodological standpoint, the proposed framework contributes to the growing literature on qualitative scenario modeling, particularly within the domain of sustainability and environmental strategy. It complements fuzzy logic and rule-based approaches by providing a formal yet data-light alternative that prioritizes logical progression over statistical fitting. The model's compatibility with interdisciplinary inputs from environmental science to corporate governance further enhances its applicability across stakeholder groups.
In practical terms, this approach can support early-stage policy planning, corporate strategy design, and risk scenario analysis. For instance, firms navigating decarbonization pathways or governments shaping carbon taxation regimes could use such models to explore the structural implications of different strategic decisions without requiring full econometric validation.
Future work should address several open questions. Most notably, efforts should be made to incorporate probabilistic weighting or stability analysis into the transition graph structure, possibly through hybrid models that combine qualitative logic with Bayesian belief networks or stochastic rule evaluation. Additionally, validation using empirical case studies based on partial data or expert-augmented simulation would help demonstrate real-world relevance and build user trust. Finally, the model’s scalability and robustness under more complex variable sets should be evaluated.
CONCLUSION
This study presented a qualitative, trend-based modelling framework tailored for analysing carbon emission strategies and ESG-financial dynamics in data-poor environments. Grounded in verbal reasoning and heuristic relationships, the model offers an interpretable, low-information alternative to conventional quantitative approaches.
By translating expert knowledge into pairwise trend relationships and encoding these within a logically consistent scenario space, the model facilitates structured exploration of system dynamics without the need for statistical estimation or numerical calibration. The resulting scenario and transition graph reveal not only equilibrium configurations and developmental pathways but also key leverage points, particularly in relation to carbon strategy and environmental governance.
The inclusion of common-sense algorithms, operating on minimal qualitative values, ensures that the modelling process remains accessible, interdisciplinary, and resilient to data unavailability. This methodological simplicity does not limit analytical rigor; rather, it enhances applicability in real-world decision-making, where uncertainty and ambiguity are pervasive. Nonetheless, the framework is not without limitations. Its qualitative nature restricts probabilistic inference and requires careful expert elicitation to minimize bias and ensure representativeness. Additionally, the absence of empirical validation limits its standalone predictive power.
Future research should extend this work in several directions. Hybrid models that integrate qualitative trend logic with probabilistic reasoning could bridge the gap between interpretability and predictive depth. Application to empirical case studies, particularly in regulatory or corporate ESG planning, would further demonstrate the framework’s value. Finally, automation of trend model construction and expansion to larger variable sets may enhance scalability and operational use.
In summary, the presented framework contributes to the growing repertoire of low-data, high-uncertainty modelling tools. It offers a structured, scenario-based alternative for understanding complex systems and supporting sustainable decision-making in the face of incomplete information.
AUTHOR'S CONTRIBUTIONS
The author confirms sole responsibility for the following: study conception and design, data collection, analysis and interpretation of results, and manuscript preparation.
LIST OF ABBREVIATIONS
| CAS | = Carbon strategy |
| BOE | = Board environmental orientation |
| PRO | = Profitability |
| LOS | = Loss |
| CAE | = Capital expenditure |
| LEV | = Leverage |
| BLS | = Block shareholding |
| FSI | = Firm size |
AVAILABILITY OF DATA AND MATERIALS
Data supporting the findings of this article are available in the Wiley Online Library repository at https://onlinelibrary.wiley.com/doi/10.1002/bse.2351, reference number BSE2351.
FUNDING
This research was supported by an internal grant of the Faculty of Business and Management, Brno University of Technology, Czechia (Project No. FP-J-25-8779).
ACKNOWLEDGEMENTS
Declared none.

