All published articles of this journal are available on ScienceDirect.

An Analysis of Ozone and NO2 Variations during the 2014 Solar Proton Event
Authors Info & Affiliations
Abstract
Background
The stratosphere and lower mesosphere serve as critical interfaces linking solar activity, ionospheric disturbances, and variations in ozone concentrations, nitrogen compounds, and, ultimately, surface weather patterns. Fluctuations in stratospheric ozone, along with alterations in other upper atmospheric constituents, directly influence the stratospheric energy balance. These changes may impact stratospheric circulation dynamics, which can subsequently propagate to affect tropospheric climate and weather.
Objective
The aim of this study is to analyze in situ measurements of total ozone and NO2 in the upper stratosphere and lower mesosphere of the Southern Hemisphere, conducted within the framework of the Belarusian Antarctic Expedition, during the development of the 2014 solar proton event. Additionally, this work seeks to determine the response of total ozone deviations and changes in ozone vertical profiles during intense planetary ionospheric storms.
Methods
The study utilized spectroscopic measurements of trace gases in the 320–390 nm wavelength range via the zenith-DOAS method. Ground-based zenith-DOAS measurements were conducted using the MARS-B and PION-UV instruments. To evaluate the polar ozone response to ionospheric disturbances, the epoch superposition method was applied, utilizing the ionospheric planetary index Wp alongside average total ozone values over the Southern Hemisphere polar cap (63°S to 90°S), derived from MERRA-2 NOAA reanalysis data.
Results
The photochemical decay of NO2 during nighttime was experimentally observed, as evidenced by consistently lower NO2 levels in the morning compared to evening values. Synchronous and independent measurements of the slant columns of NO2 and O3 demonstrated a correlation between the temporal variation in their concentrations and the dynamics of the solar proton event.
Conclusion
Instrumental measurements of ozone and NO2 at upper stratosphere and lower mesosphere altitudes over Antarctica, conducted using MARS-B and PION-UV, indicate that the photochemical decay of nitrogen dioxide occurs during the night following the solar proton event. Given the absence of ground-level sources of ozone and nitrogen dioxide in Antarctica, these findings pertain specifically to stratospheric NO2 and O3 and support a potential role of electrical processes in stratospheric ozone formation. The study concludes that total ozone levels in the Southern Hemisphere polar cap decrease at the onset of ionospheric storms, followed by an increase once the storm subsides. A possible mechanism is proposed for the transfer of solar energy within the middle atmosphere, highlighting the critical role of ozone in this process.
1. INTRODUCTION
Changes in stratospheric ozone will depend not only on the reduction in the concentration of ozone-depleting substances but also on the influence of climate on stratospheric temperatures and circulations. In view of the strong link between ozone depletion and climate change, observations of climate and ozone variables should be undertaken and analyzed together whenever possible.
Ozone and nitrogen dioxide are among the main pollutants in the surface layer of the atmosphere (Donzelli and Suarez-Varela, 2024, Milojević et al., 2024), but these gases are equally important components of the upper atmosphere in the context of solar-terrestrial relations and climate change.
Despite its relatively small concentration, it effectively absorbs most of the Sun's ultraviolet (UV) radiation, protecting terrestrial organisms from harmful solar radiation (Barnes et al., 2022). Additionally, ozone plays a significant role in the energy balance and dynamics of the atmosphere. Changes in the intensity and composition of radiation and particle fluxes associated with solar activity primarily affect the upper and middle layers of the Earth's atmosphere, including the thermosphere (Fujiwara et al., 2023, Bruinsma et al., 2007), mesosphere (Ward et al., 2021, Andersson et al., 2014, Doronin et al., 2024), and stratosphere (Jackman et al., 2008, Jia et al., 2020). In particular, these changes impact the state of the D layer of the ionosphere, which coincides with the height of the lower mesosphere, causing alterations in the concentrations and kinetic characteristics of ions and free electrons (Andersson et al., 2016, Smith-Johnsen et al., 2018).
These atmospheric layers are the first to respond to changes in solar activity and are primary agents in the chain of “solar-terrestrial” connections (Baker and Kanekal, 2008, Ward et al., 2021, Gray et al., 2010). The last 40 years have witnessed intense research into atmospheric ozone, particularly following the discovery of the ozone hole over Antarctica. It has been shown that stratospheric ozone profiles and stratospheric and tropospheric dynamics influence each other, forming the basis of stratospheric-tropospheric interaction (Baldwin et al., 2007, Baldwin et al., 2021, Gillet and Thompson, 2003).
The stratosphere and lower mesosphere represent regions where processes likely facilitate the coupling between the Sun, ionosphere, ozone, and surface weather (Sinnhuber et al., 2012, Lee et al., 2021). Solar activity significantly affects total ozone (TO) and its vertical distribution in the atmosphere (Semeniuk et al., 2011, Kalakoski et al., 2023, Ball et al., 2019). At high latitudes, the deposition of high-energy particles associated with solar proton events (SPEs) leads to the production of excessive amounts of HOx and NOx, which deplete ozone in the mesosphere and, during the winter polar night, in the upper and middle stratosphere (Jackman et al., 2000, Jackman et al., 2009, Randall et al., 2007).
Denton (2017) derived values for the decrease in the partial pressure of ozone in the Northern Hemisphere at altitudes of 16 to 24 km during 191 SPEs, excluding the natural seasonal ozone variation, based on ozone probe data. Their analysis indicates that the partial pressure of ozone decreases during winter and early spring, reaching a minimum of approximately 8 days after the arrival of the SPE. On average, the partial pressure of ozone decreases by about 10% at altitudes of 16–24 km, taking roughly 40 days to return to pre-event levels.
Other studies (Laštovička et al., 2006, Pancheva and Mukhtarov, 2011) indicate that the ionosphere is influenced by conditions in the lower atmosphere, including the stratosphere and even the upper troposphere, through various atmospheric waves and tides that propagate to the upper atmosphere. These waves and tides propagate across different latitudes and between atmospheric layers. For instance, variations in ionospheric parameters, such as the F2 layer critical frequency (f0F2) and total electron content (TEC), have been observed to depend on atmospheric waves during significant winter sudden stratospheric warming (SSW) events. This relationship has been noted not only in polar regions (Andersson et al., 2018) but also in mid-latitudes and even equatorial regions (Yiğit et al., 2016).
Conditions in the winter stratosphere at middle and high latitudes favor the upward propagation of atmospheric waves (Fritts and Alexander, 2003), making the ionospheric response to stratospheric forcing more pronounced during colder months. Stratospheric-ionospheric coupling has been observed across various latitudes and time intervals and has also been modeled using modern atmospheric and atmospheric-ionospheric models (Pedatella and Liu, 2018; Gavrilov et al., 2018).
The upper stratosphere-lower mesosphere region is critical in determining the height of the stratopause, which in turn influences stratospheric dynamics and ozone recovery. These changes can subsequently affect tropospheric circulation and regional climate. In the 1970s, Labitzke (1972) found from rocket data that changes in stratospheric winter temperatures at both low and high latitudes are accompanied by simultaneous changes of the opposite sign in the mesosphere, as well as a significant decline in stratopause height, indicating an interaction between the two layers.
Similar effects were observed by Manney (2008) using various data sources, including satellite and reanalysis data, which showed heating and a decrease in stratopause height by 30 km, along with cooling in the lower mesosphere following sudden stratospheric warming (SSW) events. Randall (2009) demonstrated that the penetration of NOx into the upper stratosphere and subsequent ozone depletion can be attributed not only to prior occurrences of solar proton events (SPE) and energetic particle precipitation (EPP) but also to meteorological factors, such as the lowering of the polar vortex, and sometimes a combination of both (Randall et al., 2005).
In this study, we present instrumental measurements of total ozone and NOX in the upper stratosphere and lower mesosphere of the Southern Hemisphere during the development of a solar flare, with data collected as part of the Belarusian Antarctic Expedition following the solar proton event (SPE). Additionally, we analyze deviations in total ozone and its vertical profiles during intense ionospheric storms in the polar region. Based on these findings, we propose a potential mechanism for the formation and destruction of total ozone in the upper and middle atmospheric layers and discuss its implications for tropospheric processes.
2. MATERIALS AND METHODS
In a given study, the MAX-DOAS instrument, MARS-B, was used in zenith mode for capturing stratospheric trace gases. The MARS-B instrument (Multi-Axis Recorder of Spectra) is a multi-axis spectral recorder (Bruchkouski et al., 2013, Bruchkouski et al., 2019). Its core component is an ORIEL MS257 (Newport Corporation, Irvine, USA) imaging spectrograph housed in a thermally stabilized, all-weather casing. The spectrograph is based on the Czerny-Turner optical configuration and features a two-dimensional 1024 × 256 pixels CCD matrix sensor DV420-OE (Andor Technology, Belfast, UK), which is Peltier-cooled to a temperature range of -50 to -60 °C.
A key distinguishing feature of the MARS-B instrument is its radiation input system, comprising a rotating mirror and focusing lens. The mirror is operated by a stepper motor with a gearbox, where each 1° rotation of the telescope corresponds to 103 motor steps. The mirror positioning accuracy, determined experimentally during the Cabauw Intercomparison campaign for Nitrogen Dioxide measuring Instruments (CINDI-2), is ±0.1° in elevation, reflecting minor uncertainties in the telescope's mechanical components. In the optical layout, the entrance slit defines the aperture’s viewing angle, yielding a total angular field of view of 1.3° in the vertical direction.
To enhance the effectiveness of the thermo-stabilization system, all electronic components, including the power supply units and spectrograph control system, were relocated outside the all-weather case and housed with the control computer. This configuration allowed for the physical separation of the optical and electronic components.
For the given study, spectra were captured in the 341–500 nm wavelength range in zenith geometry using full-resolution imaging mode, with a total angular field of view of 1.3° and a full width at half maximum (FWHM) of 0.5 nm. The spectrograph’s thermo-stabilization was maintained at 31 ± 0.9 °C.
The obtained spectra were processed using the Differential Optical Absorption Spectroscopy (DOAS) procedure with the WinDOAS (BIRA/IASB, Brussels, Belgium) software. The following absorption cross-sections and parameters were employed:
NO2: 298 K (with one applied I0-correction and a slant column density (SCD) of 1017 molec/cm2) (Vandaele et al., 1996)
O3: 223 K (Bogumil et al., 2003)
O4: (Keller-Rudek et al., 2013).
H2O: HITEMP (Rothman et al., 2010)
Ring: Ring_NDSC2003 (Chance and Spurr, 1997)
Polynomial degree: 5
Intensity offset: Constant
The MARS-B instrument conducted measurements from 5 January, 2014, to 28 February, 2014, at the Progress Station in East Antarctica (69°23′S, 76°23′E). Scattered solar radiation from the zenith of the sky at twilight was recorded, and each day's data were processed separately using a reference spectrum collected on the same day at noon, aiming to retrieve differential slant column densities (DSCD).
The idea of the MAX-DOAS method is to register solar radiation scattered from different viewing directions. In practice, it is more convenient to use elevation angles above the horizon (Fig. 1). To retrieve total columns of nitrogen dioxide and ozone from twilight measurements; the assumption was made that the air mass factor for identical observation geometries would be consistent (although it strictly depends on the aerosol state of the atmosphere and the vertical distribution of the trace gases or vertical column densities (VCD)). Therefore, for the specified geometry of twilight observations, a specific conversion factor between slant column densities and total columns should exist, which can be calculated using ancillary measurements. Satellite data from GOME and OMI were utilized as these ancillary measurements. Thus, for a solar zenith angle (SZA) of 91° and a telescope elevation angle (EA) of 90°, the corresponding conversion factor was determined, enabling the calculation of total column densities using the following formulas:
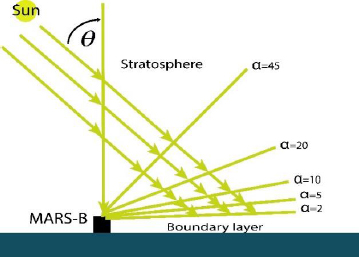
Simplified scheme of the MAX-DOAS observation geometry by MARS-B.
TCNO2 = DSCDNO2·0.031
TCO3 = DSCDO3·2.18·1018
Also, for level height assessment, the normalized DSCDs have been used:
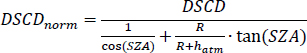 |
where:
R is the radius of the Earth,
hatm is the average atmospheric height (approximated as 40 km).
In situ data from the PION-UV spectroradiometer (Ivanov et al., 1999, Liudchik and Krasouski, 2010) were also used to retrieve total ozone column measurements. The PION-UV operates within a spectral range of 280–450 nm, with a resolution of 0.8 nm. It measures total solar radiation across the entire celestial hemisphere, enabling them to retrieve total ozone column values even in the presence of clouds. The instrument is sealed and thermally stabilized for all-weather use in polar conditions. Measurements were conducted every 30 minutes during the period from December 2013 to March 2014 at the Progress Station in East Antarctica (69°23′S, 76°23′E). The look-up table method, combined with the LibRadTran radiative transfer model, was used for retrieving the total column of ozone from the PION-UV measurements. Instrument overview employed in the study is presented in Table 1.
The obtained time series of total columns of nitrogen dioxide and ozone were compared with satellite data from the Ozone Monitoring Instrument (OMI) (https://avdc.gsfc.nasa.gov/pub/data/satellite/Aura/OMI/) (Levelt et al., 2006), Global Ozone Monitoring Experiment (GOME) (https://navigator.eumetsat.int/product/EO:EUM: DAT:0860) (Burrows et al., 1999) and ECMWF reanalysis data (http://ecmwf.int/en/forecasts/datasets) during the development of a solar proton flux according to NOAA Solar Weather Prediction Center (NOAA/SWPC Boulder Observatory, USA) (https://www.swpc.noaa.gov/products/goes-proton-flux) (Lombardi and Hanson, 2005).
| Instrument | Manufacturer | Software | Geometry |
|---|---|---|---|
| MARS-B | NOMREC, Minsk, Belarus | Andor Basic script as control program, WinDOAS for DSCD retrieval |
Zenith, FOV = 1° |
| PION-UV | NOMREC, Minsk, Belarus | Delphi script as control program, LibRadTran for TC retrieval |
Full hemisphere |
Ionospheric disturbances were assessed using data from the ionospheric planetary index Wp (Gulyaeva and Stanislawska, 2008; Gulyaeva et al., 2013), obtained from the IZMIRAN website (https://www.izmiran.ru). The W system of ionospheric weather indices enables the calibration of the state of the ionosphere and plasmasphere, ranging from calm conditions to intense storms. The degree of ionospheric disturbance is assessed based on data from a network of observatories, as well as from nodes of global maps of total electron content (GPS-TEC), covering the period from 1994 to 2022. This level of disturbance is represented by the W index:
W=±1 for a quiet state,
W=±2 with moderate disturbance,
W=±3 with a small storm,
W=±4 during intense storm.
The ± sign indicates the positive or negative deviation of log(NmF2/NqF2) or log(TEC/TECq) at each observation point from the quiet median level over the preceding 27 days (one solar revolution). The values of the planetary index Wp for ionospheric disturbances exceeding 6 units correspond to very intense ionospheric storms on a planetary scale and were utilized in the analysis of all storm cases. From 1994 to 2022, a total of 37 ionospheric storms with index values above 6 units were recorded.
As the TO parameter, we selected the average TO values for the polar cap of the Southern Hemisphere (from 63° S to 90°) according to the MERRA and MERRA-2 NOAA reanalysis data (https://ozonewatch.gsfc.nasa.gov/). The indicators of deviation of TO from the long-term period (range years - 1978-2022) in this polar region (the polar cap of the Northern and Southern Hemisphere) were calculated. Next, using the method of superimposing epochs, changes into deviations from the long-term period were obtained during ionospheric storms for all 37 cases for the eastern and western phases of the Quasi-Biennial Oscillation (QBO). Data on QBO phases were used from the website of the Berlin Institute of Meteorology (https://www.geo.fuberlin.de/en/met/ag/strat/produkte/qbo/index.html).
3. EXPERIMENT AND RESULTS
3.1. Vertical Profiles Assessment of Ozone and Nitrogen Dioxide over Antarctica during a Solar Proton Event
Measurements with the MARS-B instrument during the Antarctic expedition were conducted from 25 January, 2014, to 28 February, 2014, at Progress Station (69º23′S, 76º23′E). The instrument operated in MAX-DOAS mode to investigate aerosol profile parameters and in zenith mode during twilight for trace gas measurements, focusing on the retrieval of stratospheric NO2 and O3 concentrations and layer heights. The results were compared with satellite data and ECMWF reanalysis data and are presented in Fig. (2).
To examine the diurnal patterns of nitrogen dioxide and ozone DSCDs, we employed numerical modeling of radiative transfer processes in the atmosphere using the LibRadTran radiative transfer model (Mayer and Kylling, 2005). Based on synthetic data, it can be inferred that during the measurement period, the ozone layer was positioned lower than the NO2 layer. This is also supported by layer height estimates derived through a geometric approach. Consequently, variations in normalized DSCD concentrations of trace gases depend on the solar zenith angle (SZA), with maximum values corresponding to layer height. As shown in Fig. (2), the twilight DSCD shape changes with different SZAs, indicating the relative positions of the gas layers. Additionally, Fig. (2) reveals an increase in maximum ozone values from reanalysis data while corresponding NO2 maxima decrease, suggesting a potential interaction between ozone and NO2.
During the period of joint NO2 and O3 measurements, a significant SPE occurred, characterized by the eruption of high-energy particles into the upper atmosphere. This phenomenon leads to a marked increase in nitrogen dioxide concentrations in the mesosphere and stratopause region, as illustrated in Fig. (2), while ozone concentrations at these altitudes decrease correspondingly.
The high-altitude nitrogen dioxide layer in the upper atmosphere inhibits stratospheric ozone production. As the nitrogen dioxide content in this layer decreases, maximum ozone concentration shifts to higher altitudes, and total ozone content in the layer increases. Twilight zenith observations of nitrogen dioxide and ozone align well with satellite measurements from GOME and OMI, as well as data from the PION-UV instrument. Analysis of the data series in Figs. (2 and 3) yields the following conclusions:
- During polar day conditions, morning and evening stratospheric nitrogen dioxide levels are similar. However, as the nighttime duration increases, the morning-evening difference grows until it reaches a stable level, remaining at approximately 40%. This pattern provides clear experimental evidence of nitrogen dioxide photochemical decay overnight, as morning levels are consistently lower than evening levels;
- Synchronous and independent measurements of NO2 and O3 slant column densities (DSCDs) reveal a correlation between their temporal variations and the dynamics of solar proton events. Given the absence of surface sources for ozone and nitrogen dioxide in Antarctica, these observations pertain to stratospheric NO2 and O3, underscoring the significant role of solar proton events in stratospheric ozone formation. (Fig. 3) illustrates the superposition of reanalysis data and solar neutron flux measurements from NOAA/SWPC Boulder Observatory in the USA;
- (Fig. 4) further demonstrate that solar proton flux reduces NO2 concentration in the high-altitude layer, which subsequently leads to an increase in O3 concentration and a rise in the ozone layer's altitude. This interaction underscores the complex dynamic between solar activity and stratospheric composition, particularly in the formation and behavior of stratospheric ozone;
3.2. Changes in Polar Ozone during Intense Ionospheric Storms
Based on the instrumental measurements obtained by the MARS-B device, it was suggested that ozone could be formed due to additional ionization in the upper stratosphere. In this connection, cases of ionospheric storms and polar ozone deviations were considered. As a result, when averaging and processing all 37 cases of intense ionospheric storms, the TO deviations change from normal in the polar cap of the Southern Hemisphere as follows (Fig. 5). From ten to twelve days before the ionospheric storm peak (it is 0 day), TO increases sharply by 7-8 DU, when the ionospheric storm begins (on average it is -3 day) TO decreases by 4-5 DU. After the end of the ionospheric storm (on average it is +3 day), there is again a smooth increase by 5 DU. At the eastern phase of QBO, there is a growth of TO deviation in the Southern Hemisphere polar cap after the storm and at the western phase of QBO - before the storm begins (Fig. 6).
In the polar cap of the Northern Hemisphere, the opposite behavior of TO is observed. At the time of the storm onset (on average, it is -3 day), there is an increase in TO. The TO changes during ionospheric storms at different QBO phases differ little from each other and have increasing values throughout the storm development time. A sample of only the autumn-winter and winter-spring cases in the Southern Hemisphere showed that at the background of a general decrease of ozone due to the polar vortex and the formation of the ozone hole, there is a slight TO increase only in the first and preceding days of the storm onset, while in the Northern Hemisphere, all seasons reflect the TO increase at the time of the ionospheric storm onset. Thus, perhaps ionospheric storms or ionization of the atmosphere (in the zone upper stratosphere – lower mesosphere) can be an indirect factor of TO increase depending on the QBO phase and polar zone of the hemisphere.
Comparison of the series of modeled and in situ measured data for the period 25.01.2014-28.02.2014. Top to bottom: ECMWF reanalysis partial pressures of NOх and O3; normalized DSCD (in SZA) of NO2 and O3 by MARS-B; assessments of VCD NO2 (in SZA) and O3 (in Dobson Unit, DU) from MARS-B and others instruments.
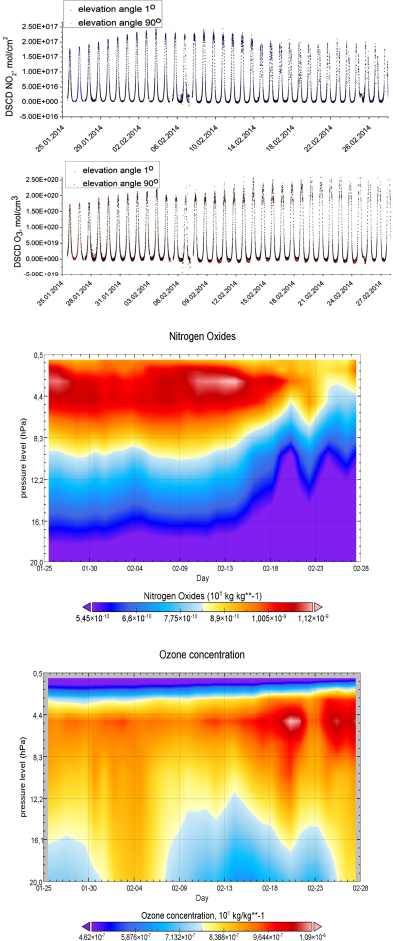
Total column NO2 and O3: measurements at dusk. Top-down: total nitrogen dioxide (in mol/cm2) and ozone (in DU) content according to MARS-B data, comparison with GOME and OMI satellite data and with PION-UV radiometer data (in Dobson unit, DU) for the period 24 January 2014 – 01 March 2014.
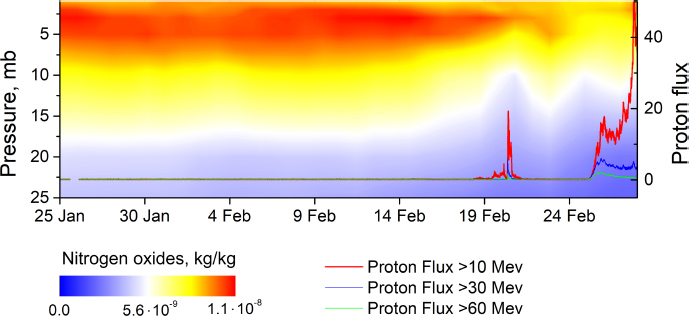
The comparison of nitrogen oxides partial pressure derived from ECMWF data and solar proton flux (measured in MeV) from the NOAA/SWPC Boulder Observatory in the USA highlights their relationship during the solar proton event from 25 January 2014 to 28 February 2014.
Such changes in TO during the development of ionospheric storms can be explained by the fact that during a storm (especially if it is modulated by SPEs, etc.) additional NOx, O2, and HOx ions are formed, which destroy ozone molecules (Jackman et al., 2000, Heath et al., 1977). The subsequent growth of TO is explained by the abrupt reduction of ozone molecules due to the reduction of destructive nitrogen compounds and increased ionization of the upper stratosphere.
In order to investigate the changes in the vertical profiles of ozone and other rare gas components (from MERRA-2 reanalysis) of the middle atmosphere for the Belarus polar station area (Enderby land, 67°39´33´´S; 46°09´30´´E), the case of a powerful ionospheric storm for 2004 was considered, which began on 7 November, reached its peak on 8 November at 10 h UTC, and ended on 14 November. This storm is distinguished by the fact that it was induced by an SPE the night before 6 November and was the longest and strongest of all intense storms according to the W-index criterion. The W-index values at the peak of the ionospheric storm reached 9.9 points (very intensive storm).
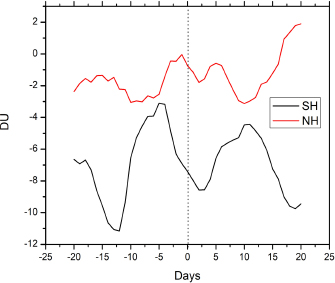
Deviation of TO (in DU) in the polar cap for the Northern (NH) and Southern Hemisphere (SH) from long-term period 1978-2022 during 37 cases of planetary ionospheric storms according to the Wp index. Day 0 - the peak of the ionospheric storm.
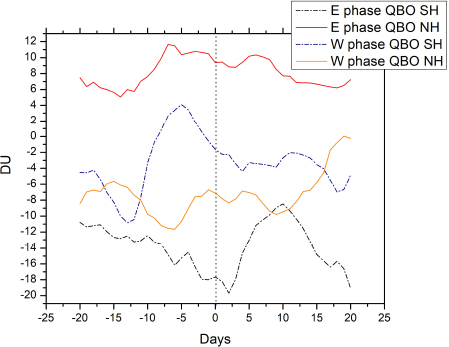
Deviation of the TO (in DU) in the polar capfor the Northern (NH) and Southern Hemisphere (SH) from the long term period 1978-2022 during ionospheric storms by the W index during the western (n=22) and eastern (n=15) phases of QBO. Day 0 - the peak of the storm.
When considering the vertical profiles of the rare gases components of the middle atmosphere during the development of the SPE and ionospheric storm in November 2004, the following points were revealed (Fig. 7). There was an active growth of ozone concentration (by absolute value of partial density, the increase from 1 November to 15 November was about 100·10-9 kg/m3) in the upper (at levels from 5 to 10 hPa) and middle (at levels from 10 to 70 hPa) stratosphere accompanied also by growth of NOx (NO2 and NO) concentrations. The latter were mainly changed and increased down the vertical atmospheric column (at levels from 10 to 50 hPa).
At the ionospheric storm peak on 8 November, the ozone concentration at 10 hPa slightly decreased due to the growth of NO2 concentrations at the background of further general growth. By the end of the ionospheric storm, the ozone growth continued and the NOx concentrations decreased to the initial value. As a result, the ozone profile was partially transformed by the growth of NOx concentrations (NO2 and NO).
4. DISCUSSION
The formation of sunspots is accompanied by the emission into the surrounding space of large amounts of energy (solar wind) in the form of protons, electrons, and high-energy gamma-quanta - products of the vital activity of the powerful thermonuclear boiler that is the Sun. The cycles of 11, 22, and 100 years, typical of solar activity, can be traced in many climatic processes, such as the occurrence of droughts and floods, the intensity of thunderstorms, cyclonic activity, etc. (Hong-yan et al., 2015).
Two types of mechanism models have been proposed to explain the response of the Earth's climate to solar activity variability:1) traditional - a mechanism linking variations in total solar radiation directly to processes in the troposphere;2) alternative - a mechanism that affects the upper atmosphere, as a result of the action of the solar wind.
Stratospheric ozone occupies a special place in the second mechanism. Many researchers note that changes in stratospheric ozone together with changes in other stratospheric components directly (for example, Damiani et al., 2016, Fytterer et al., 2015) or indirectly influence (for example, Cagnazzo et al., 2013, Gerber et al., 2012) stratospheric radiation balance causing changes in stratospheric temperature and circulation, which in turn influence the tropospheric climate. Changes in stratospheric ozone due to direct radiative forcing can affect both stratospheric and tropospheric circulation (Shalamyansky, 2013; Kidston et al., 2015; Hudson et al., 2003; Hudson et al., 2006).
The energy of the Sun that reaches the Earth's atmosphere is electromagnetic (from radio waves to X-rays) radiation and corpuscular flow (protons and electrons). Electromagnetic radiation makes the greatest energy contribution to the Earth's atmosphere. Corpuscular radiation is trapped in the upper layers of the atmosphere, which respond the most to changes in the solar wind. These changes lead to various photochemical and electrical transformations of the chemical composition of the upper and middle atmosphere in the polar regions. In particular, NOx and O3 consistently act as “transmitters” of ion energy and electromagnetic radiation energy of the short-wave ultraviolet range. There are two ways NOX can appear in the stratosphere induced by EPP interactions: the first way is that NOX can be created directly in the stratosphere (direct effect) through ionization and dissociation of N2 and O2 (Rusch et al., 1981); the second way is that NOX can be formed in the mesosphere and then descend into the stratosphere (indirect effect) (Randall et al., 2006).
In either case, solar wind ions and electrons do not directly reach the ionosphere and upper stratosphere but undergo a transformation (“exchange”) for lower-energy particles. At the heights of the magnetosphere this transformation is manifested as northern lights. Changes in the number and dynamics of charged particles moving in the Earth's magnetic field can lead to additional heating of the layer and changes in the constants of photochemical reactions and, consequently, to changes in the chemical composition of the upper atmosphere. Solar rays (or external influence) ionize the upper layers (from 60 km and above) of the atmosphere by increasing positive ions NO+ and O+, which creates electric perturbations in the lower ionosphere (Mitra, 1974).
In the stratopause region (60-70 km), ozone formation is determined by the local height of the lower ionization layer belt. A decrease in the amount of NO+ ions in the lower ionosphere in the stratopause region leads to a local increase in stratospheric ozone concentration (Randall et al., 2006).
Measurements in the Antarctic in 2014, which were described in section 2, confirmed the correctness of the assumptions stated above for the conditions of a pure experiment - under conditions of minimal anthropogenic influences (Bruchkovski et al., 2014). The results obtained in section 3 can provide a prerequisite for the electric nature of ozone formation in the upper stratosphere. Changes in the vertical profiles of ozone during the development of the largest ionospheric storms that follow SPE showed that the main growth of ozone is observed in the upper and middle stratosphere. The growth of nitrogen dioxide and nitrogen monoxide restrains the current growth of ozone concentration initiated by electrical processes in the upper stratosphere-lower mesosphere.
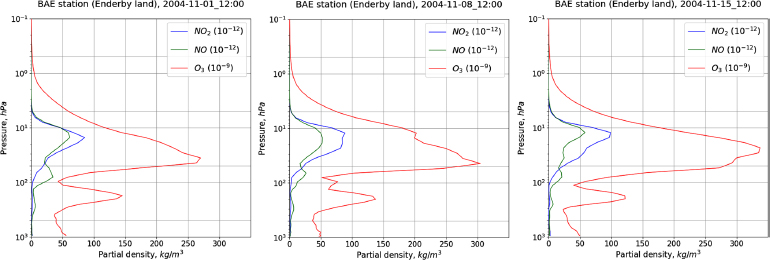
Vertical profiles of O3 and nitrogen oxides (NO, NO2) (in kg/m3) for Enderby Land, Belarus polar station for 1 November, 8 November and 15 November, 2004 (from MERRA-2 reanalysis).
Descending downwards vertically under the action of the deposition process, ozone experiences mainly a relaxation decrease of the local concentration (Ishidoya et al., 2013, Ishidoya et al., 2018, Ishidoya, 2008) due to collisions with destructor molecules, according to Chapman's reactive chains (Chapman, 1932). In the upper stratosphere, because of the long free path, both downward and horizontal diffusion of ozone occurs at a higher rate than in the lower stratosphere, where the concentration of molecules increases sharply.
The analysis of data from orbital observations of the movement of ozone anomalies together with data from numerical modeling in the WRF (Weather Research Forecast) and IFS (Integrated Forecast System) systems also showed a correlation with the specifics of changes in weather conditions along the route of the anomalies (Barodka et al., 2016, Krasouski et al., 2020). The accumulated material of instrumental observations of ozone in the polar regions and modeling of ozone anomalies in connection with short-term climate change allowed us to put forward a hypothesis of the influence of stratospheric ozone on the local climate or extreme weather events, the so-called ozone mechanism.
It is carried out not through a direct influence on the atmospheric air flows but by changing the height of the tropopause, which in turn determines the position of stationary fronts and, correspondingly, the characteristics of the global circulation cells in the troposphere. The mutual influence of tropospheric and stratospheric mechanisms depends on the region and time of year. In the tropical region, thermodynamic processes (convection) in the unstable troposphere prevail, while in the polar latitudes, the stratospheric ozone mechanism dominates year-round. Both mechanisms act simultaneously and compete with each other.
4.1. Main Provisions of the Proposed Mechanism Model
The main “transmission link” of the influence of the processes developing in the upper atmosphere on the troposphere is the atmospheric ozone layer, which is formed due to the photophysical creation of ozone in the upper stratosphere by hard UV radiation from the Sun (as well as under the influence of electrical processes in the lower mesosphere). Solar activity modulates the state of the mesosphere, and both the ionic composition of the layer and the characteristics of atmospheric electric fields (or geomagnetic storms or solar proton events) change, which affects the process of ozone formation in the upper stratosphere. This is where ozone is mainly created. Since in this area, the relative concentration of ozone is high, the ozone created by diffusion and gravitational deposition actively spreads both vertically downward and spatially. Ozone accumulation leads to stratospheric warming and the lowering of the tropopause layer, especially when there is a high concentration of ozone in the lower tropopause of polar regions.
The stratospheric ozone field is formed by the competition of two mechanisms, one of which, conventionally termed “radiative, alternative, top-down”, is responsible for ozone formation in the upper stratosphere and lowers the tropopause height, the other, “traditional, convective, thermodynamic, bottom-up” acts in the troposphere, creates conditions for dry and wet instability and due to this raises the height of the tropopause, as a result of which the total ozone content decreases (although in both cases the temperature of the tropopause increases).
“Thermodynamic mechanism,” that is, the heating of the underlying surface and increase of air temperature in an unstable troposphere leads to the “rise” of the tropopause layer. At the same time, the area of “negative altitude temperature gradient” increases. The probability of ozone molecules being destroyed by water vapor molecules, hydroxyl ions and other destructors. High tropopause, less ozone (tropical zone).
Briefly, the mechanism of stratospheric influence on weather and climate change can be formulated as follows: while thermodynamic processes in the unstable troposphere (vertical convection) tend to raise the tropopause higher, the effect of the ozone mechanism in the stratosphere (absorption of solar radiation and radiative heating) lowers its level. Processes in the stratosphere, significantly related to the processes in the mesosphere and ionosphere, changing the height of the stratopause and tropopause in this region, influence the position of stationary atmospheric fronts that separate global circulation cells and climatic conditions. The latter conclusion is also supported by the results of numerical simulations (Krasouski et al., 2021).
The presence of such a possible mechanism, on the one hand, explains the influence of solar activity on atmospheric processes and, on the other hand, shows the way in which man, affecting various layers of the atmosphere in resonance with solar rhythms, can actively influence atmospheric processes.
CONCLUSION
The obtained instrumental measurements (MARS-B, PION-UV) of ozone and NOx at altitudes of the upper stratosphere-lower mesosphere in Antarctica after the SPE showed the fact of photochemical decay of nitrogen dioxide during the night (since morning values are always lower than evening values). Since there are no ground-level sources of ozone and nitrogen dioxide in Antarctica, the obtained result applies to stratospheric NO2 and O3 and clearly proves the possible role of electrical processes in the creation of stratospheric ozone.
It is concluded that during the onset of ionospheric storms, TO in the polar cap of the Southern Hemisphere decreases almost by 2 times, and immediately after the end of the ionospheric storm, its increase is again observed almost to the initial values. During the eastern phase of the QBO, TO deviations in the polar cap of the Southern Hemisphere has more intensive increase after the end of ionospheric storms than during the western phase of the QBO. Definitely, at any phase and hemisphere during the development of an ionospheric storm, polar TO decreases.
Changes in vertical ozone profiles during the development of the largest ionospheric storms that follow solar proton events have shown that the main increase in ozone is observed in the upper and middle stratosphere. The increase in nitrogen dioxide and nitrogen monoxide is constrained by the current increase in ozone concentrations initiated by ionization in the upper stratosphere-lower mesosphere. At the final stage of the storm, after the NOx growth has stopped, the ozone concentration continues to increase for some time in the upper and middle stratosphere.
A possible mechanism for the transfer of solar energy in the middle atmosphere, where ozone plays an important role, is proposed. The essence of the ozone mechanism is the photochemical formation of ozone molecules due to the absence of ionized compounds NOx in the upper stratosphere - lower mesosphere layer after external disturbances and its subsequent gravitational sedimentation in the lower stratosphere.
The analysis did not take into account other factors affecting ozone - the Antarctic ozone hole, which sometimes extends into the first month of spring; SSWs and the collapse of the polar stratospheric vortex in the Northern Hemisphere, which significantly affect the distribution of ozone.
The analysis used data averaged over the entire polar region and experimental measurements. The results probably need to be checked on data for a specific region at midlatitudes of the Northern Hemisphere, more cases of solar proton events, and take into account the specific natural phenomena affecting total ozone, which are described above.
AUTHORS’ CONTRIBUTIONS
S.Z.: Involved in the writing, review and editing; T.S.: Contributed to the data analysis, methodology and writing – original draft; A.K.: Provided the supervision, conceptualization and writing – original draft; V.Z.: Presented the investigation, data analysis, writing – review and editing; S.B.: Contributed to the formal analysis, data curation and visualizations; I.B.: Involved in instrumental measurements, data analysis and validation.
LIST OF ABBREVIATIONS
| SPEs | = Solar proton events |
| TEC | = Total electron content |
| SSW | = Sudden stratospheric warming |
| EPP | = Energetic particle precipitation |
| MARS-B | = Multi-Axis Recorder of Spectra |
| CINDI-2 | = Cabauw Intercomparison campaign for Nitrogen Dioxide measuring Instruments |
| DSCD | = Differential slant column densities |
| VCD | = Vertical column densities |
| SZA | = Solar zenith angle |
| OMI | = Ozone Monitoring Instrument |
AVAILABILITY OF DATA AND MATERIALS
The authors confirm that the data supporting the findings of this research are available within the article.
FUNDING
This study was funded by Institute of Nature Management" of the National Academy of Sciences of Belarus, Awards/Grant number, grant No. 0213749.
ACKNOWLEDGEMENTS
The authors express their gratitude to the Republican Polar Center in Belarus for conducting expeditions to Antarctica and for supporting in conducting measurements.

