All published articles of this journal are available on ScienceDirect.

Sustainable Fishing? Ecological Footprint Analysis of an Artisanal Fishing Organization
Abstract
Background:
Small-scale fisheries are an important economic sector in terms of employment, national food security, enterprise development and foreign exchange earnings. Overfishing is one of the main impacts directly affecting fisheries. However, there are other kinds of global impacts not frequently considered. The ecological footprint indicator is not new but has been mostly overlooked by scholars in the artisanal fishing sector. The aim of this study was to evaluate the corporate ecological footprint of small-scale fisheries through a fishing cooperative at La Cruz de Loreto in Mexico, and determine its eco-efficiency as non-direct global impacts.
Methods:
The Compound Method Based on Financial Accounts (MC3.V.2 for its acronym in Spanish, version 2) was used. It includes the categories of emissions, materials, resources, services and contracts, land use and waste.
Results:
Eco-efficiency, determined by the organization´s ecological footprint, was 0.6 t/ha and its carbon footprint was 0.2 t/tCO2 per year, a low one when compared to others. The consumption category that contributed most to the footprint was indirect emissions and the ecosystem’s fossil energy, which could be explained by the characteristics of the fishing cooperative analyzed.
Conclusion:
The corporate ecological footprint for La Cruz de Loreto fishing cooperative is low when compared to others, but it indicates that they should improve in the category of indirect emission (reduce the consumption of electricity generated by fossil fuel and use of alternative energy) and should invest in the “forest” type of ecosystem to increase carbon sinks and mitigate the impacts.
1. INTRODUCTION
Fishing has been globally recognized as an essential activity to achieve food security. However, it has also been noted that fishing activities must develop according to each ecosystem’s natural capacity for the recovery and availability of fishing resources.
Fishing cooperatives are considered a viable option to satisfy societal demands such as the creation of jobs, increased availability of food and a better distribution of profit and resources derived from fishing activities. In Mexico, slightly over 70% of small-scale fishermen (artisanal anglers) are organized through cooperatives (Valenzuela Reyes 2012). Cooperatives are a form of a social organization composed of people with common interests who work together under the principles of both solidarity and individual effort. They satisfy individual and collective needs through economic activities of production, distribution and consumption of goods and services (Diario Oficial de la Federación 2018).
Some of the problems faced by fishing cooperatives, which often stem from their own practices, include the decline of different fish populations due to global overfishing, ocean acidification and other phenomena such as El Niño Southern Oscillation. In Mexico, over-fishing, the collapse of fisheries and the use of low trophic levels species are prevalent across the country, posing a risk for several marine ecosystems. Small-scale fisheries are the main contributor to the problem, as they dominate the fishing sector (Arreguín-Sánchez and Arcos Huitrón 2011). In addition, the precariousness of fishing labor and the poor living conditions of most fishermen and their families are intensified by the displacement of fishermen from their traditional workspaces (beaches and docks) to other areas caused by the development of megaprojects (tourism, energy and real estate).
The Ecological Footprint (EF) is an integrated indicator that allows the estimation of the consumption of resources and the requirements of waste assimilation of any human population or economic system in terms of its productive land area (Wackernagel and Rees 1996). It relates the population’s consumption of natural resources in a territory to an area of “nature”, which is then compared to the area’s biocapacity in order to calculate the size of the ecological debt.
The EF has been used as an indicator of development in the last three decades to show unsustainability at different levels. This tool has become very popular among scholars as shown by a multidisciplinary database review (from 1995 to 2019, Web of Science), which includes 636 documents (Clarivate 2018) with the term “ecological footprint” in the title. However, its importance at the micro-level has been questioned by some researchers who concluded that it helps organizations to find areas of intervention in their paths to sustainability and to improve economic benefits (Csutora and Harangozo 2017; Gergely et al. 2018; Schaltegger and Csutora 2012) that are related to the corporation’s social responsibility (Herva et al. 2008).
The evaluation of the EF is considered as an indicator of organizational and corporate performance in environmental issues (Wiedmann and Barrett 2010) and as a baseline for consumption and emissions derived from companies’ assets (Limpitlaw et al. 2017). The EF tool has also been used in the fishing sector to find out which activities were carried out by a company change over time (Carballo Penela, Doménech et al. 2008). This adaptation of the classic EF can measure a company’s environmental impact expressed through the productivity of the area or through its carbon emissions equivalents (Dómenech and González-Arenales 2008).
Impacts caused by fishing methods vary depending on locations and cultures, but the precise impacts of each method are dependent on the scale, management and techniques used when fishing. It has been recognized as one of the main causes of marine ecosystems modification (Crowder et al. 2008), where the impacts on biodiversity are the result of combined actions of overfishing, bycatch and degradation of habitat. These conditions change the species composition of communities, structure, function and productivity of marine ecosystems, ultimately altering food chains. The most commonly assessed impacts caused by fisheries are the direct and local ones. However, their global effects can also be measured through the operation of the fishing cooperative as an organization that carries out specific activities and requires the consumption of materials and services, so the final product (fish) accumulates those generated impacts, which can then be translated into a correspondent area and equivalent CO2 emissions.
The total EF is calculated by adding its different parts in terms of categories of consumption, including the fishing zone, which refers to the biologically productive maritime surface used by humans to obtain fish and shellfish. The most recent results indicate that the global EF in 2014 was 2.84 global hectares (gha1) per capita, and only 0.09 gha corresponded to the sea. In Mexico, in the same period, the footprint was 2.55 gha per capita, and the sea represented 0.08 gha (Global Footprint Network 2017). Global hectares can be converted to CO2 emissions.
Variants of the EF methods have been developed to assess emissions in different scales, from nations to individuals, from local activities to enterprises. The corporate EF proposed by Doménech and Carballo (Doménech 2006; Carballo Penela, Doménech et al. 2008; Cagiao et al. 2011) can be used for a single enterprise or a cooperative organization (Carballo Penela et al. 2009). As reported in these papers, it was built as a tool to evaluate a company’s method of production based on life cycle assessment methodology characterized by its top-down approach. It first calculates the organization’s footprint and then distributes it among the products that it manufactures. Another advantage of the corporate EF tool is that it is based on financial accounts, evaluating the company based on its own rates of production, and ensuring that no data is left out. However, gathering data is dependent on the bookkeeper’s level of literacy and ability to document the data.
It is important to explore the EF in artisanal fishing cooperative organizations to obtain an indicator of sustainability as well as establish a guide to improve the eco-efficiency2 of fishing activity, which seeks to produce more wealth with fewer resources. It should be noted that this approach does not express all the impacts of the fishing sector recognized by various authors, but rather focuses on a small-scale fishing cooperative organization as a model for others through its categories of consumption based on its monetary expenses. As small-scale fisheries are not “inherently more sustainable”, a collective effort is required for an improved understanding of its impacts as proposed by Jones et al. (2018). The aim of this research was to evaluate the corporate ecological footprint of small-scale fisheries taking a fishing cooperative organization in Mexico: La Cruz de Loreto, as a model to determine its eco-efficiency. It is located in the municipality of Tomatlan in the state of Jalisco, on the central coast of the Mexican Pacific. This organization includes 62 associated fishermen, 32 vessels and 186 trammel nets with 3½, 4 ½, 5 and 6 inches of mesh opening. They catch fish, crab and shrimp. In 2010, they had a total catch of 91.65 metric tons and an annual income of $197,984.05 USD (Bravo-Olivas et al., 2015). Fishes are caught in Agua Dulce-El Ermitaño Estuarine Lagoon System and are commercialized locally, in the cities of Puerto Vallarta and Colima.
1 A global hectare is a common unit that comprises the average productivity of the entire biologically productive land and sea area in the world in a given year. The use of a common unit allows different types of land to be compared using a common denominator.
2 The World Business Council Sustainable Development (WBCSD) developed eco-efficiency concept for in 1992, in its publication "Changing Course". It is based on the idea of creating more goods and services using less resources.
1.1. Background
The ecological footprint has been used in the fishing sector in various ways, one of these, to assess the biophysical efficiency of production and catch systems. Tyedmers (2000) analyzed and compared the biophysical efficiency of two salmon production systems, by catch and by crop, using the ecological footprint tool and the energy analysis. The results indicate that salmon farming is biophysically less efficient, and therefore the least sustainable system to produce salmon in British Columbia.
The corporate Ecological Footprint (EFc), derived from the concept of ecological footprint, can be defined as the environmental impact of any organization, caused by the purchase of supplies, products sale, space occupation and waste generation. It is a tool used to evaluate and communicate the environmental situation of organizations and companies.
Doménech (2004) applied the EFc indicator in the port of Gijón, Spain, where the resultant footprint is calculated based on electricity consumption, water consumption, waste generation, spending on services, space occupation, and fuel consumption. Doménech (2006) determined that the impacts produced by the processes carried out by the port, mainly infrastructure maintenance and ship docking, were equivalent to what 5,298 hectares of biologically productive ecosystems produce. This methodology was also used by Carballo Penela and García-Negro (2008b) and Carballo Penela, Doménech et al. (2008) measured the EFc of two companies in the fishing sector in Galicia and found significant differences despite being apparently quite similar. The analysis made it possible to identify those areas that favor these differences, being mainly the consumption of fuels and the baits used.
Carballo Penela and García-Negro (2008b) estimated EFc using the “Composed Method of Financial Accounts” (MC3.V.2 for its acronym in Spanish, version 2) developed by Doménech (2004, 2007) to a canning company in Galicia. The results identified the categories of consumption that generate a higher EFc (sea products, direct and indirect energy consumption, cultivated products, and forest resources), besides showing a reduction in the footprint reported last year, due to a lower level of activity of the company. Using this same method, Carballo Penela and García-Negro (2008a) estimated the EF of a mussel-producing company in 2002 and 2007; their results showed a reduction in EF, caused mainly by the company's vessel's fuel consumption. Similarly, there was an increase in the footprint in 2007, due to two factors related to the farming system and repairs on the boat.
An application of the EF tool in the northern coastal region of Jalisco (Chávez Dagostino 2007) determined the EF at the municipal level. Differentiating rural from urban areas found that in all cases there was an ecological deficit (the amount by which its ecological footprint exceeds the ecological capacity available locally), in addition to the low Human Development Index (HDI) and marginalization characteristic in the region, which implies a double challenge for regional sustainability.
Currently, there are very few applications of the concept of fishing footprint in the world; in Mexico, there are no published research papers where the concept of EF has been used as an indicator of sustainability in fishing cooperatives.
2. MATERIALS AND METHODS
The EFc is an indicator that provides an analytical framework for the study of the human demand for bioproductivity. The “Composed Method of Financial Accounts” (Carballo Penela et al. 2009a, 2009b) based on the general concept of EF (Wackernagel and Rees 1996), was applied to the fishing cooperative La Cruz de Loreto. The first step in the process was to establish what and how much they consumed in a typical year, related to their main activities (fishing; store, transport and sell product; purchase and repair fishing gear, other services). The fleet, composed of small 32 boats, was not included here since it is not usually acquired in a typical year,but we included the maintenance services of the vessels in the next item.
Then a list of the main categories of products consumed in the fishing cooperative was prepared in a spreadsheet, as main sources of CO2 emissions, including sections for the generated waste and land use (Table 1).
| Consumption Sections | Consumption Categories |
|---|---|
| Direct Emissions | Fuels Other direct Emissions |
| Indirect Emissions | Electricity Other indirect Emissions |
| Materials | Flow materials (merchandise) Non-redeemable materials Redeemable materials (generic) Redeemable materials (construction) Use of public infrastructures |
| Services and Contracts | Low mobility services High mobility services Passenger transport services Merchandise transport service Use of public infrastructures |
| Agricultural and fishing resources | Clothing and manufactured products Agricultural products Restaurant services |
| Forestry resources | |
| Water footprint | Consumption of drinking water Consumption of non-potable water |
| Land use | On land On water |
| Waste, discharges and emissions | Discharges in effluents Emissions |
The information was gathered through direct interviews and reviews of reports and annual accounts of the cooperatives, which provided the input data to fill out the spreadsheet MC3 V.2.0 (Carballo Penela et al. 2008, 2009a, Bravo-Olivas et al. 2015). Data included fuel consumption, energy, materials, services, natural and agricultural resources, forest resources, water, land use, and waste. The spreadsheet, which was originally designed for the calculation of the corporate footprint of the Port Authority of Gijon, was modified so that only the items consumed by the small-scale fishing cooperative were considered (Table 1). The carbon footprint and ecological footprint were simultaneously calculated using these data.
The calculation of the consumption items is reported in a study by Cagiao et al. (2011) and has been described previously by other authors (Carballo Penela et al. 2008, 2009a), and a brief description of the procedure used in the fishing cooperative case is described below.
The basic consumption categories used for the cooperative organization were: a) Fuels, b) Electricity, c) Materials, d) Services and contracts, e) Agricultural and fishing resources, f) Water, g) Land use, h) Waste, discharges and emissions (Table 1). At first, the input data are in different units, so the final objective is to fix all of them in the same units: an area for ecological footprint and CO2 tons for the carbon footprint.
The footprint calculation of each consumption item is mentioned below:
Fuels: The footprint is calculated by converting the consumptions in tons of each type of fuel to Gigajoules (GJ), through its lowest energy intensity according to the Report of Greenhouse Gases (based mainly on IPCC (1996)). The GJ consumed and its emission factor were used to calculate the carbon footprint.
Electricity: The consumption data in kWh obtained from the supplier company (Comisión Federal de Electricidad in Mexico) are converted to GJ at a rate of 1 kWh = 3.6 MJ (1kWh = 0.0036 GJ or 3.6 GJ / MWh). Then using the percentage of the performance of the different types of energy generation technologies, the tons of fuel consumed is calculated, dividing the GJ consumed by the lowest caloric power. The carbon footprint is then calculated by applying the emission factors of the consumed fuel.
Materials: It is necessary to assign consumption categories to each element of the company's accounts. Once the data have been entered, they will automatically be converted from monetary units (pesos) to tons of products, using the table of statistical data of foreign trade that records the entry and exit of all merchandise. The conversion of tons of products to GJ consumed in their life cycle is done, through the energy intensity. The sources of energy intensities are the same as those used by the classic method of ecological footprint (Wackernagel et al. 2005).
Services and contracts: To calculate the footprint of services and contracts, the procedure consists in estimating the percentage of the invoice that refers to the energy consumed by the activity expressed in tons of liquid fossil fuel. This consumption is converted to GJ and the calculation continues as in the fuel footprint.
Agricultural and fishing resources: The same procedure is followed as in the calculation of the material footprint: the conversion of the quantity in weight to tons of product, the conversion of tons to GJ through energy intensity, and the conversion of CO2 tons released by the emission factor of liquid fossil fuels. However, these organic resources have a particularity: compared to inorganic materials, in addition to the energy footprint, they also leave a trace due to the space occupied by the activities of land and forestry. Therefore, it is possible to calculate the ecological footprint dividing the consumption in tons by its natural productivity in t/ha, which gives the occupied space belonging to the cultivated lands, pastures, forests and sea, depending on whether the resources consumed are, for example, cereals, meats, paper or fish. Once the space occupied in hectares has been calculated, then the equivalent CO2 emissions can be converted through the absorption factor of these ecosystems.
Water: The water footprint is calculated on the basis of drinking and non-drinking water consumption, divided into several different categories, which allows independent corrective actions to be taken. It can have two types of footprints: an energy footprint due to collection and distribution (pumping, etc.) and the others refer to land use (forests, as primary water producers). The energy consumption of these services comes to 0.65kWh /m3, according to the data taken from the records of the Institute for Diversification and Energy Saving in Spain (IDAE 1989).
Land use: The carbon footprint due to land occupation and the loss of bioproductive space used to absorb CO2 is calculated by converting the hectares of CO2 through the absorption factor of the occupied ecosystem:
(a) The absorption factor of forests is estimated at 3.67 tC/ha/year (IPCC 2001); (b) in agriculture, the absorption rate of crops is 1.98 tCO2/ha/year (0.54 tC/ha/ year), with no distinction between organic and conventional agriculture (ECCP 2004); (c) the type of pasture is estimated at 0.23 tC/ha/year or 0.84 tCO2/ha/year (Flanagan et al. 2002; Soussana et al. 2004; Suyker and Verma 2001); (d) it is assumed that the sea has an absorption of 0.55 molC/m2/year on average for all the world's oceans (without making any distinction between the zones), which is equivalent to 0.242 tCO2/ha/year (Sabine 2004); e) waste, discharges and emissions. The footprint of the waste, discharges and emissions could be calculated according to Marañón et al. (2008), using a “model” final treatment plant, as well as a “model” treatment station, where the carbon footprint was calculated with this methodology.
This approach was used to determine which activities were carried out by the company that generated the highest EF and its eco-efficiency (economic results/environmental results).
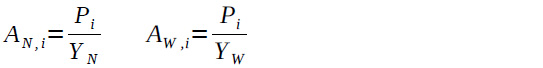
The MC3 methodology also includes the concept of natural capital (NC), as the opposite of EF, which is the available area to the organization (forest, pastures, sea, etc.). If the EF is bigger than the available productive surface, the NC will be negative (debt). Considering that, the MC3 carbon footprint can also be expressed in terms of EF, the methodology used by Wackernagel and Rees (1996) is applied using an equivalence factor (EqF). It allows the addition of all the types of spaces (representing the average global productivity of a bioproductive area in relation to the global average of all bioproductive areas), and the application of the Yield Factor (YF), which is the factor of local productivity against global productivity. For example, if the productivity of forests is similar to the average productivity worldwide, the yield factor will be 1, whereas if the local productivity is twice as large as the world’s productivity, then the yield factor will be 2. It is calculated based on the annual availability of usable products. The yield factor of an area, for any type of land use given, is calculated as shown in eq. (1):
 |
(1) |
Where:
U is the set of all the useful primary products that land can produce,
AW,i is the area needed to provide worldwide in each year, the available quantity of product
AN,i is the area needed to provide for that region in each year, the available quantity of product i.
These areas were calculated as shown in eq (2):
 |
(2) |
Where:
Pi is the annual national growth of production i,
YN is the national yield,
YW is the worldwide yield.
The yield factors reflect the relative productivity of a country and the global average of hectares of a certain type of soil. Every country has a yearly performance factor for each type of soil. Biocapacity is reported in global hectares. They were calculated for each type of soil, considering the following sources:
a) Cropland: Statistics of crop production for Mexico provided by FAO Stat FAO ResourceSTAT Statistical Database, b) Grazing: Animal production statistics provided by FAO Stat FAO ResourceSTAT Statistical Database, c) Forests: The yield is the annual net increase of marketable timber per hectare. Production was obtained from the Global Forest Resources Assessment (Food and Agriculture Organization, 2010) and FAO Stat FAO Resource STAT Statistical Database, d) Built-up land: As for arable land, it is assumed that most of the built-up area occupies cultivated land, e) Marine waters: Established by Global Network Working (Borucke et al. 2013), calculation based on the average rates of net primary productivity of the national exclusive economic zone, f) Inland waters: This was set to 1, assuming that all inland waters are equally productive.
Equivalence factors previously calculated by Ewing et al. (2010) were used to calculate the footprints of the different types of soil, converting the actual hectares to their equivalent global hectares.
Yield and equivalence factors apply to both biocapacity and footprint calculations in order to give consistent and comparable unit results (Table 2).
3. RESULTS
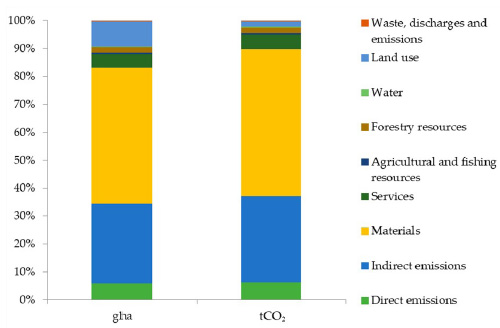
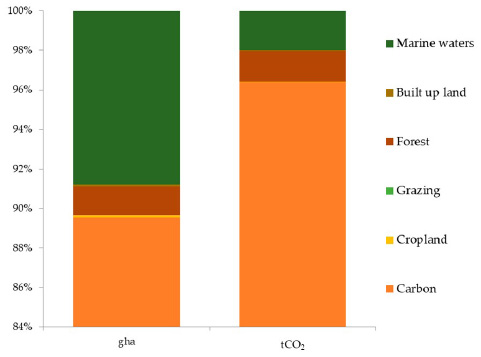
In 2010, the fishing cooperative La Cruz de Loreto produced a net ecological footprint of 164.43 gha and a net carbon footprint of 453.37 tCO2. The most important contribution to the footprint was made by indirect emissions derived from electric energy used to produce ice in the “cold room” (Table 3). The most affected ecosystem type was the one used as a carbon sink to absorb the emissions due to catch and the built-up surface. Emissions from grazing were non-significant (Table 4).
The consumption of non-organic products (derived from plastic for the construction of fishing gear) represents the largest proportion of both footprints and the consumption of water for food use is the lowest one (Table 5, Figs. 1 and 2).
| Land | Equivalence Factors Rate |
Yield Factors Rate |
|---|---|---|
| Fossil Energy | 1.29 | 1.29 |
| Cropland | 2.52 | 0.75 |
| Grazing | 0.46 | 1.21 |
| Forest | 1.29 | 0.66 |
| Built-up Land | 2.52 | 0.75 |
| Marine Waters | 0.37 | 1.07 |
| Inland Waters | 0.37 | 1.00 |
| Consumption Category | Expenditure (USD$) |
|---|---|
| Direct Emissions | 5,325 |
| Indirect Emissions | 11,819.9 |
| Materials (no organic) | 6,484.8 |
| Services | 6834.9 |
| Agricultural and Fishing Resources | 107.6 |
| Forestry Resources | 768.8 |
| Water | 123.7 |
| Surface | gha | tCO2 |
|---|---|---|
| Carbon | 161.64 | 446.0 |
| Cropland | 0.23 | 0.17 |
| Grazing | 0.000001 | 0.000002 |
| Forest | 2.62 | 7.22 |
| Built up Land | 0.17 | 0.12 |
| Marine Waters | 15.85 | 9.22 |
| EF Net | 180.51 | 462.76 |
| NC | 16.08 | 9.39 |
| EF Gross | 164.43 | 453.37 |
| Consumption Category | Fossil Fuel | Cropland | Grazing | Forest | Built Up Land | Marine Waters | Total | |||||||
| gha | tCO2 | gha | tCO2 | gha | tCO2 | gha | tCO2 | ha | tCO2 | gha | tCO2 | gha | tCO2 | |
| Direct Emissions | 10.6 | 29.3 | 0.0 | 0.0 | 0.0 | 0.0 | 0.0 | 0.0 | 0.0 | 0.0 | 0.0 | 0.0 | 10.6 | 29.3 |
| Indirect Emissions | 51.5 | 142.0 | 0.0 | 0.0 | 0.0 | 0.0 | 0.0 | 0.0 | 0.0 | 51.5 | 142.0 | |||
| Materials | 88.4 | 243.9 | 0.0 | 0.0 | 0.0 | 0.0 | 0.0 | 0.0 | 88.4 | 243.9 | ||||
| Services | 8.9 | 24.5 | 0.0 | 0.0 | 0.0 | 0.0 | 8.9 | 24.5 | ||||||
| Agricultural and Fishing Resources | 0.9 | 2.4 | 0.2 | 0.2 | 0.0 | 0.0 | 0.0 | 0.0 | 1.1 | 2.6 | ||||
| Forestry Resources | 1.0 | 2.8 | 0.0 | 0.0 | 2.2 | 6.2 | 0.0 | 0.0 | 3.3 | 9.0 | ||||
| Water | 0.0 | 0.0 | 0.0 | 0.4 | 1.0 | 0.0 | 0.0 | 0.4 | 1.0 | |||||
| Land Use | 0.0 | 0.0 | 0.0 | 0.0 | 0.2 | 0.1 | 16.3 | 9.2 | 16.5 | 9.3 | ||||
| Waste, Discharges and Emissions | 0.4 | 1.0 | 0.0 | 0.0 | 0.0 | 0.0 | 0.0 | 0.4 | 1.0 | |||||
| Subtotal | 161.6 | 445.9 | 0.2 | 0.2 | 0.0 | 0.0 | 2.6 | 7.2 | 0.2 | 0.1 | 16.3 | 9.2 | 181.0 | 462.6 |
| NC | 16.08 | 9.39 | ||||||||||||
| Total | 164.43 | 453.37 | ||||||||||||
The indicators of environmental and economic eco-efficiency for this cooperative are:
Eco-efficiency 1(carbon) = 0.2 t/tCO2
Eco-efficiency 1 (ecological) = 0.6 t/ha
Eco-efficiency 2 (carbon) = $432.9 USD/tCO2
Eco-efficiency 2 (ecological) = $1194 USD/ha
If the cooperative had to contribute to the carbon market, these emissions would cost (based on $17.06 USD/t) approximately $ 7734.5 USD in order to mitigate its impact.
4. DISCUSSION
Current fishing methods are very different from those used a century ago. There have been many technological improvements that have allowed a significant increase in the fishing capacity of the existing fleet. The most important change is the use of internal combustion engines, the invention of which reached different parts of the planet at different rates.
The footprint of the fishing cooperatives considered as companies can be used as an indicator of sustainability (with its limitations). For example, Carballo-Penela and Doménech (2010) analyzed the EFc of two fishing corporations in Spain and found a gross footprint of 1083.5 and 540.2 gha for each one, as well as 1678.2 and 2026.4 tons of CO2, emitted respectively, with a catch of 98.8 and 190.2 tons per year for each one. The footprint-catch ratio (considered as a sold product) produces an efficiency indicator of 10.9 gha/t versus 2.84 gha/t. This number allows companies to be compared regardless of their size. The Compound Method based on Financial Accounts offers useful information for sustainable development, environmental management of organizations and sustainable consumption, because it is a flexible, transparent and easy to apply method.
The SCPP La Cruz de Loreto caught 91.65 tons per year, so the efficiency was 1.79 gha/t and 4.9 tCO2/t, proving to be more efficient as compared to the ecological footprint of Spanish corporations in both appropriate hectares and in CO2 emissions. This could be explained due to the fact that the fishing cooperative in Spain had its biggest footprint in its consumption of fuel for vessels, while the cooperative in Mexico caught it in vessels without the use of an engine; the largest footprint was reached by the use of plastics for the construction of fishing gear.
Iribarren et al. (2011), reported a carbon footprint of 1.49 tCO2/t of fish landed from artisanal fishing operations in north-western Spain, which is probably a more comparable option.
For large fishing fleets, Winther et al. (2009), reported a lower carbon footprint for the catch of some species (0.00201 tCO2 /t for the cod caught, 0.00213 tCO2/t for the saithe, 0.00333 tCO2/t for the haddock and 0.00054 tCO2/t for the mackerel). However, this calculation excludes transportation and processing, which would increase substantially the carbon footprint.
The use of fossil fuels is the factor that contributes most to the high impact of fish catch, not only because of the use of vessel fuel, but also because of the use of fishing gears made of synthetic materials, mainly polyethylene (Verones et al. 2017). This coincides with what is generally found in the fishing cooperatives and contributes to more than 130 million tCO2 generated by fishing activity throughout the world, as reported by Tyedmers, Watson and Pauly (2005). Motorized vessels accounted for 61% of all fishing vessels in 2016, a percentage lower than the 64% was recorded in 2014, as the number of vessels without motor engines increased, probably due to the improvement in estimates (Food and Agriculture Organization, 2018).
Although EF can be used as an indicator of sustainability, it has limitations, especially when it comes to making comparisons, since it depends on time and available technology and should not be used as a predictive tool. Other limitations, when applied to fishing as an indicator, are the fact that it excludes important ecological impacts such as pollution, and that energy consumption is focused only on CO2 and excludes other greenhouse gases. Beyond comparisons between companies, the company itself can establish its strategies to reduce or compensate its footprint and track them over time.
The analysis developed focuses on the use of a surface the human being “takes as theirs” and suggests that this surface is finite. The best contribution of the concept is that it counteracts the ingrained idea that resources, in this case, fish are infinite.
In another way, although the general EF methodology provides an aggregate estimate of human demand on the biosphere, it is subjected to uncertainty in source data, calculation parameters, and methodological decisions as many calculation systems, so these results can help to see the actual state of the cooperative in terms of opportunities to advance in sustainability but should not be used to establish future scenarios.
CONCLUSION
Eco-efficiency can be evaluated to compare fishing organizations like cooperatives, where the ecological footprint can help establish strategies to improve it.
The EFc for La Cruz de Loreto fishing cooperative is low when compared to others, but indicates that they should improve in the category of indirect emission (reduce the consumption of electricity generated by fossil fuel and use of alternative energy) and should invest in the “forest” type of ecosystem to increase carbon sinks and mitigate the impacts.
Another area that can be improved is the consumption of plastic material (the biggest footprint) due mainly to fishing gear, which can be reduced by recycling, repairing, reducing the number of nets per boat and diversifying the fishing gear.
NOTES
1 A global hectare is a common unit that comprises the average productivity of the entire biologically productive land and sea area in the world in a given year. The use of a common unit allows different types of land to be compared using a common denominator
2 The World Business Council Sustainable Development (WBCSD) developed eco-efficiency concept for in 1992, in its publication “Changing Course”. It is based on the idea of creating more goods and services using less resources
CONSENT FOR PUBLICATION
Not applicable.
AVAILABILITY OF DATA AND MATERIALS
Not applicable.
FUNDING
None.
CONFLICT OF INTEREST
The authors declare no conflict of interest, financial or otherwise.
ACKNOWLEDGEMENTS
The authors are deeply thankful to anglers in the fishing organization Cruz de Loreto and to the University of Guadalajara for providing research facilities during the investigation.
REFERENCES
[CrossRef Link]
[CrossRef Link]
[CrossRef Link]
[CrossRef Link]
[CrossRef Link]
[CrossRef Link]
[CrossRef Link]
[CrossRef Link]
[CrossRef Link]
[CrossRef Link] [PubMed Link]
[CrossRef Link]
[CrossRef Link]
[CrossRef Link] [PubMed Link]
[CrossRef Link]
[CrossRef Link]
[CrossRef Link] [PubMed Link]
[CrossRef Link]
[CrossRef Link]

